- Home >
- Stock Photos >
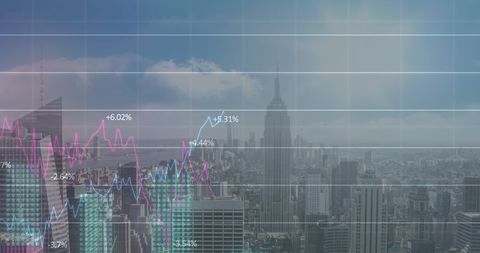
- Global Business Statistics and Data Conceptual Background
Global Business Statistics and Data Conceptual Background Image

Business professionals are engaged in data analysis, with overlaid statistics indicating global connectivity and economic trends. This visualization is ideal for materials discussing financial markets, technological advancements, and strategic business solutions.
Powered by  - Get 15% off with code: PIKWIZARD15


2
downloads
downloads
Tags:
More
Credit Photo
If you would like to credit the Photo, here are some ways you can do so
Text Link
photo Link
<span class="text-link">
<span>
<a target="_blank" href=https://pikwizard.com/photo/global-business-statistics-and-data-conceptual-background/f0878a02041c5649cffe17f3af22f248/>PikWizard</a>
</span>
</span>
<span class="image-link">
<span
style="margin: 0 0 20px 0; display: inline-block; vertical-align: middle; width: 100%;"
>
<a
target="_blank"
href="https://pikwizard.com/photo/global-business-statistics-and-data-conceptual-background/f0878a02041c5649cffe17f3af22f248/"
style="text-decoration: none; font-size: 10px; margin: 0;"
>
<img src="https://pikwizard.com/pw/medium/f0878a02041c5649cffe17f3af22f248.jpg" style="margin: 0; width: 100%;" alt="" />
<p style="font-size: 12px; margin: 0;">PikWizard</p>
</a>
</span>
</span>
Free (free of charge)
Free for personal and commercial use.
Author: Creative Art
Similar Free Stock Images

Premium


Premium


Premium


Premium


Premium


Premium


Premium


Premium


Premium


Premium


Premium


Premium


Premium


Premium


Premium


Premium


Premium


Premium


Premium


Premium


Premium


Premium


Premium


Premium


Premium