- Home >
- Stock Photos >
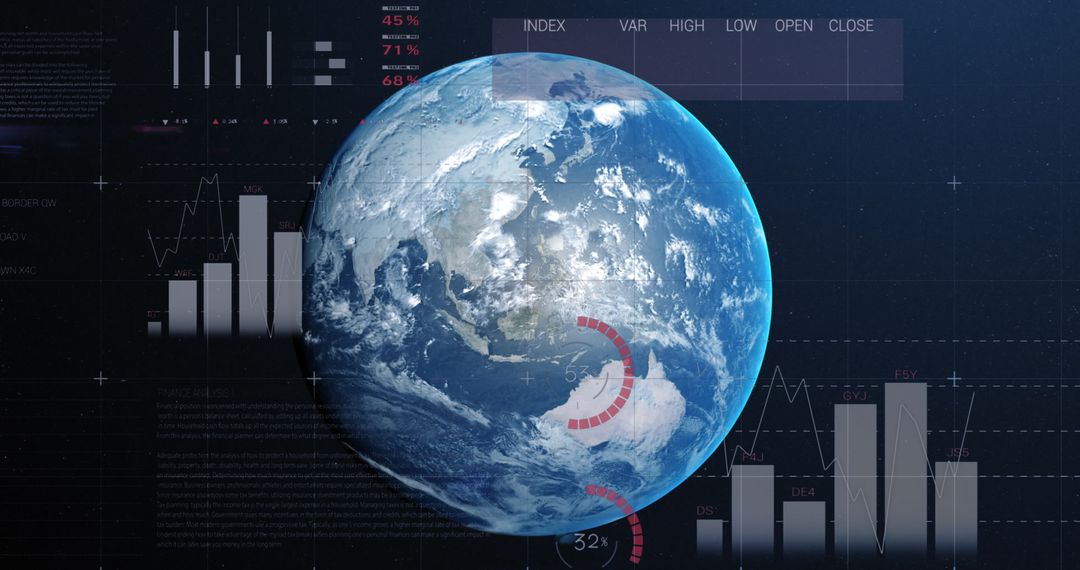
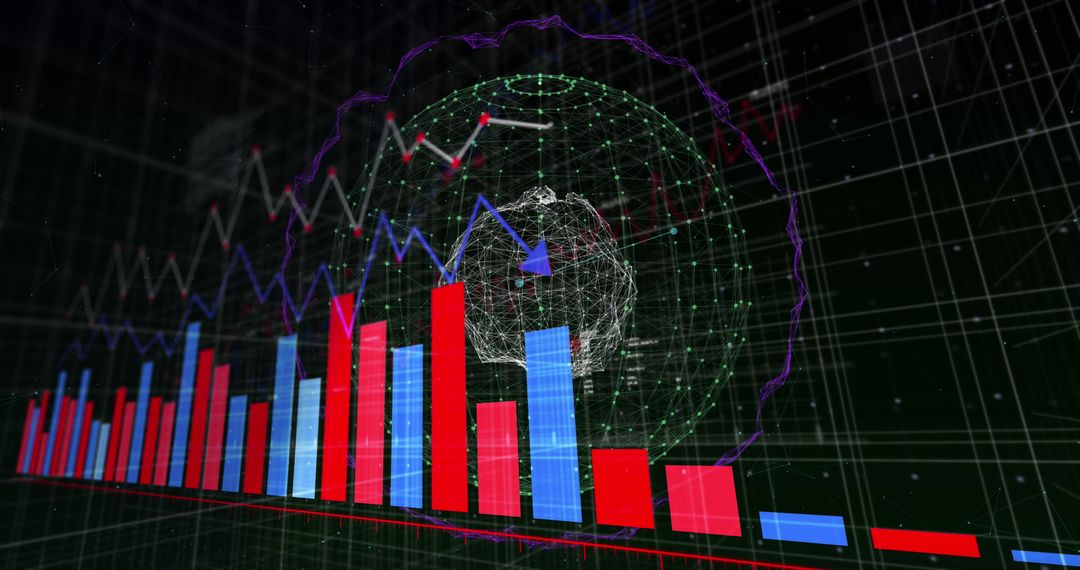
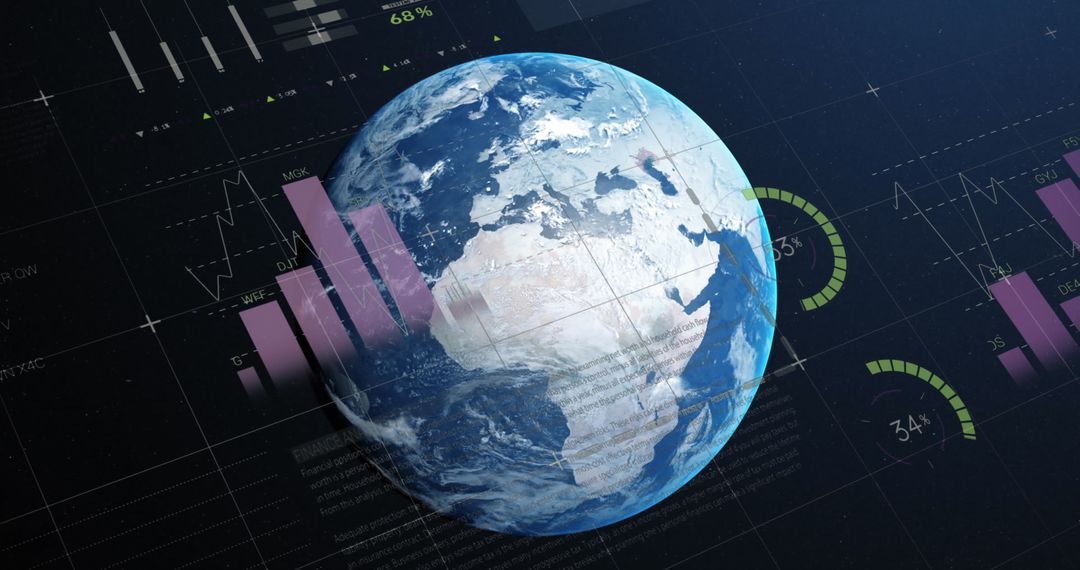
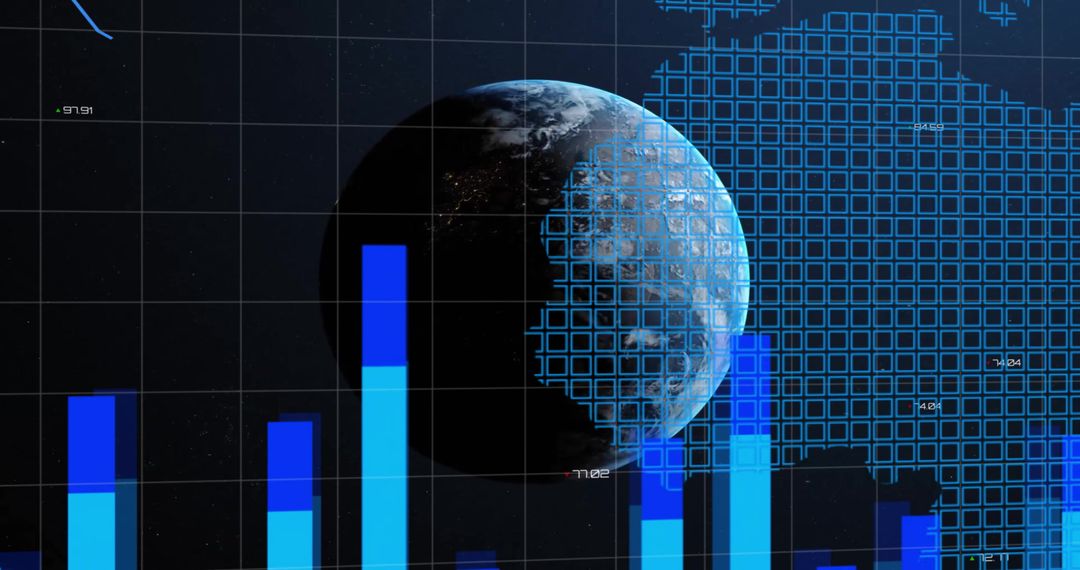
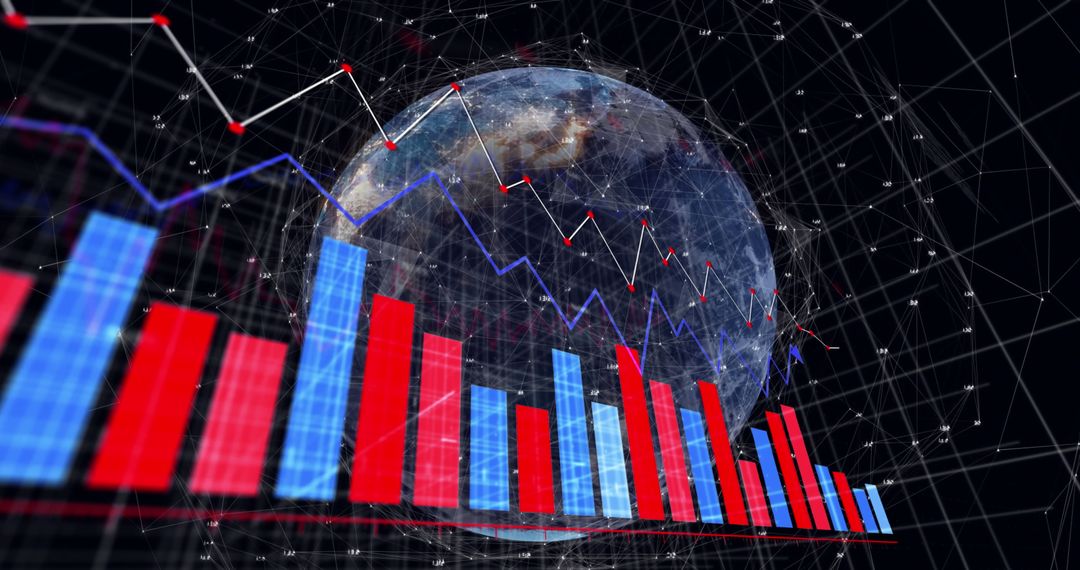
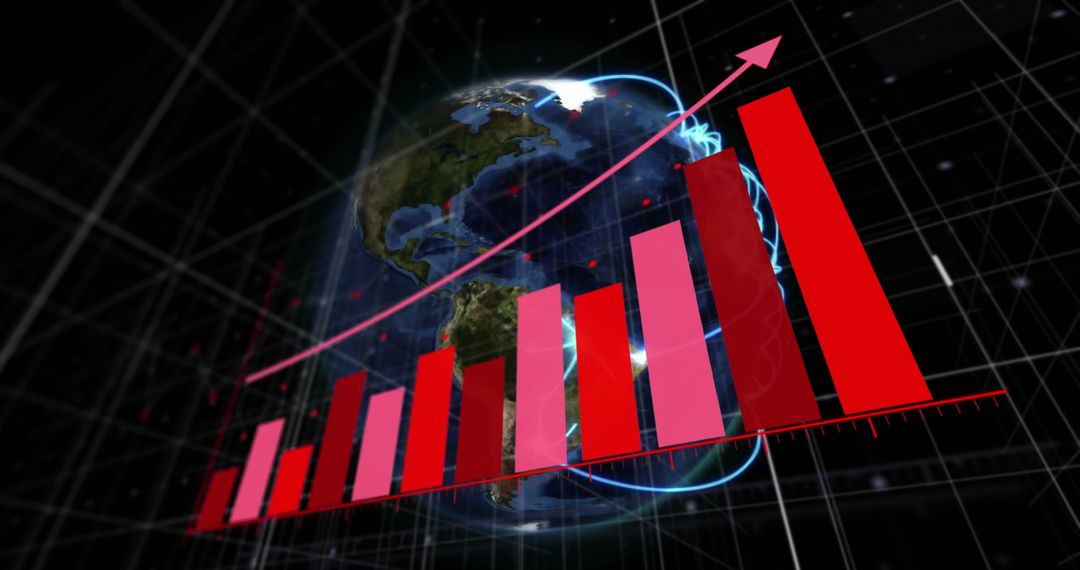
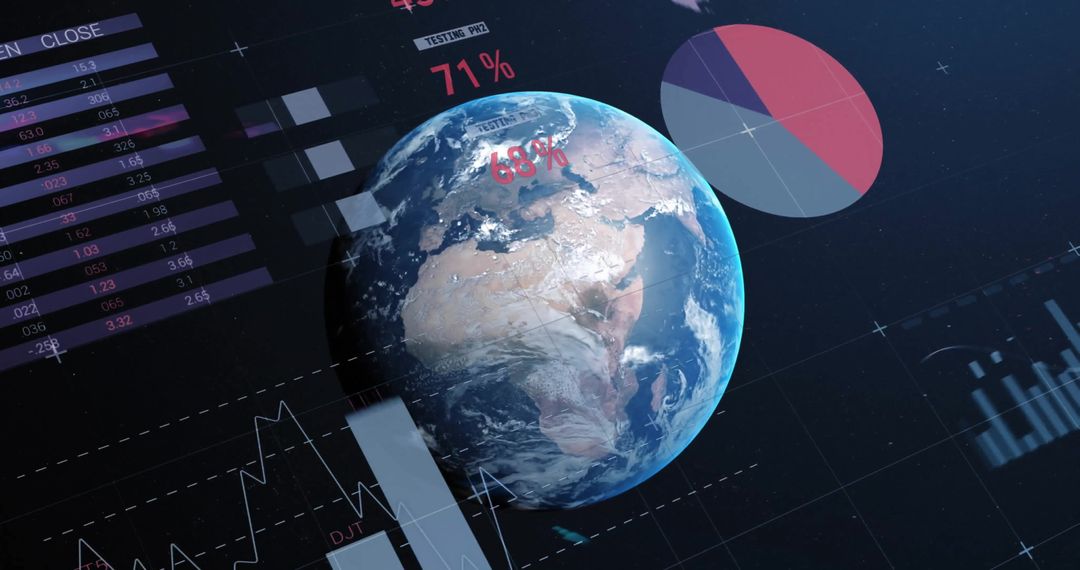
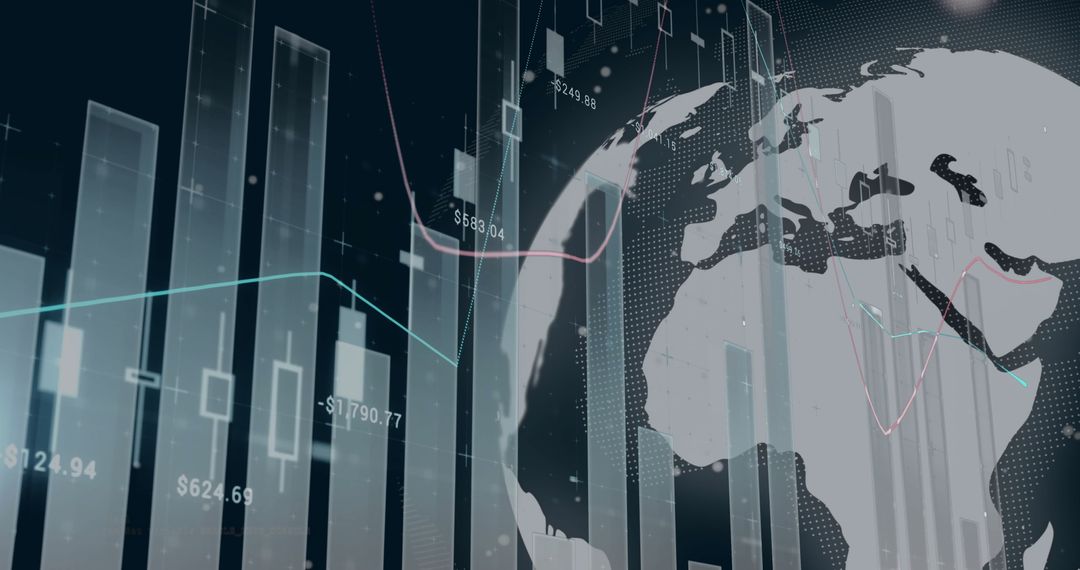
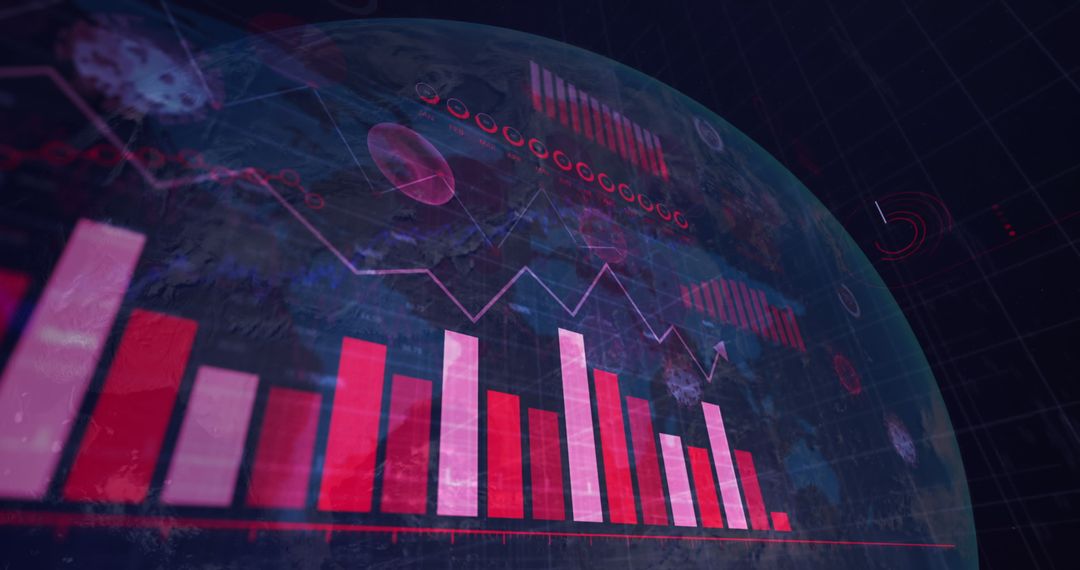
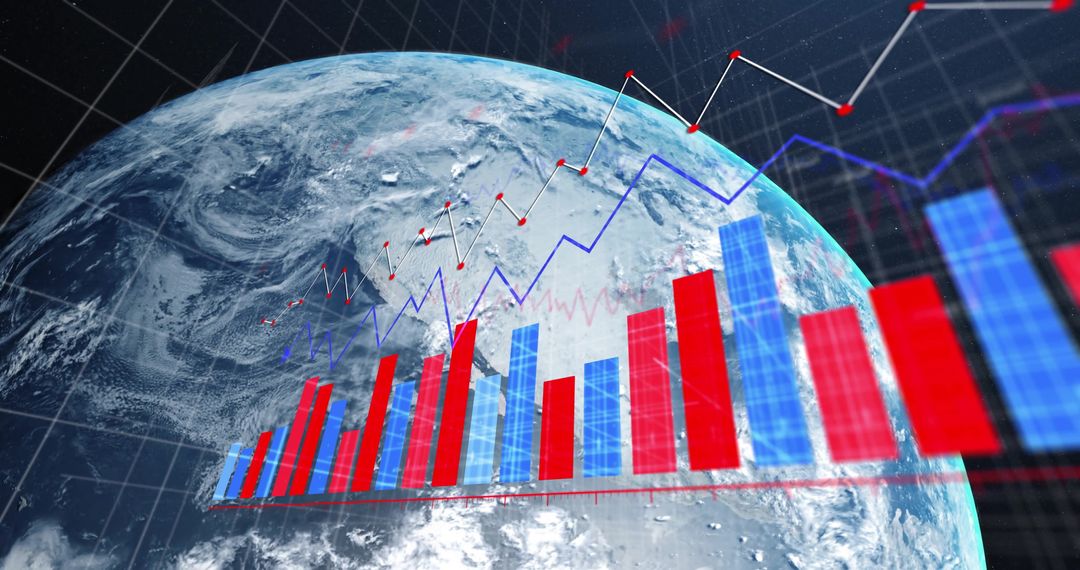
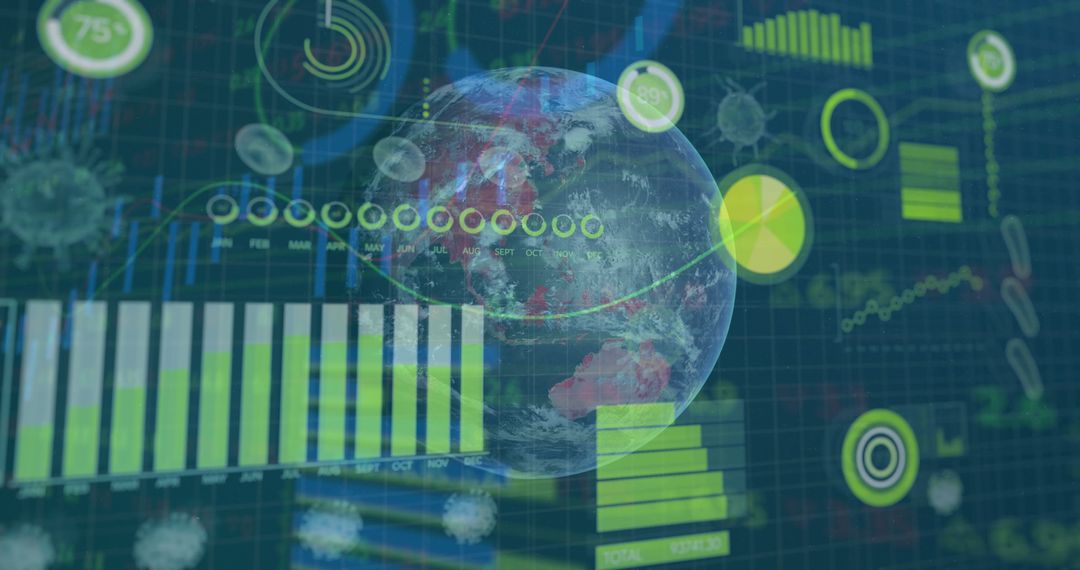
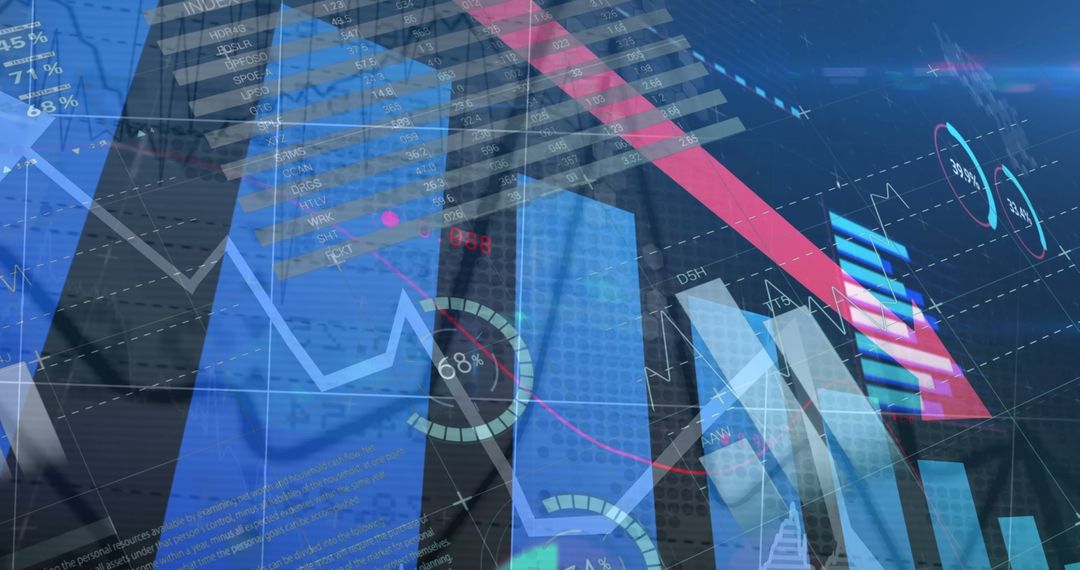
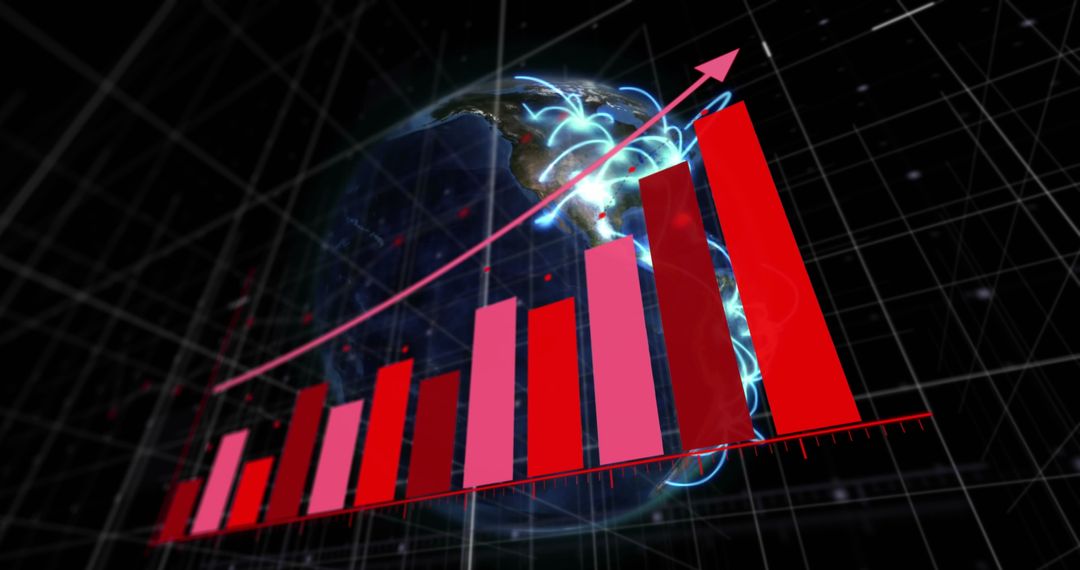
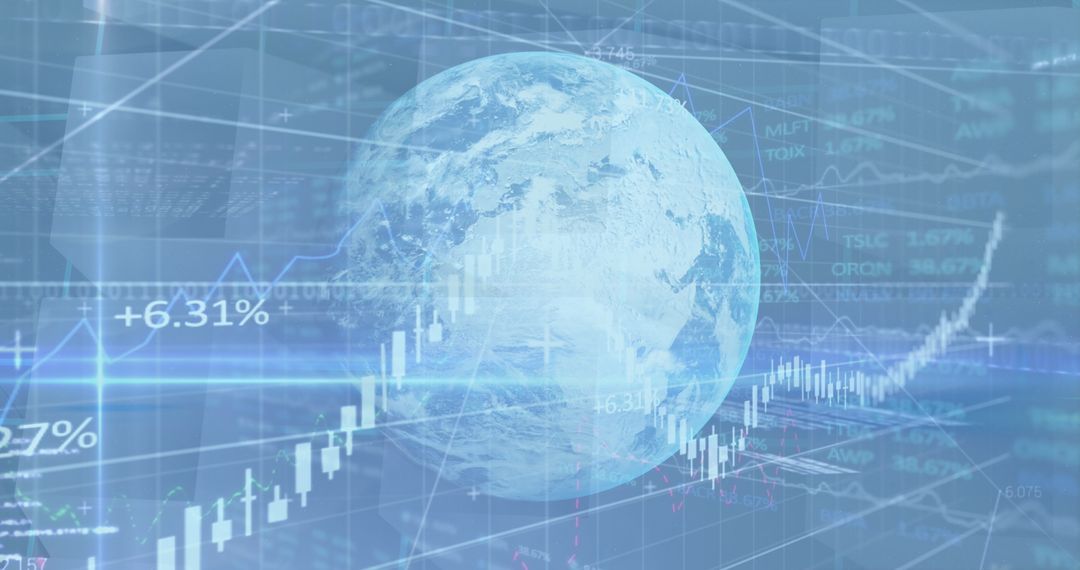
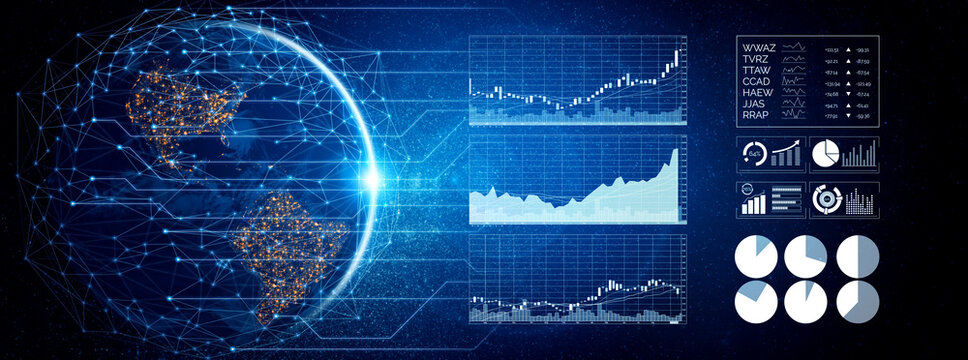
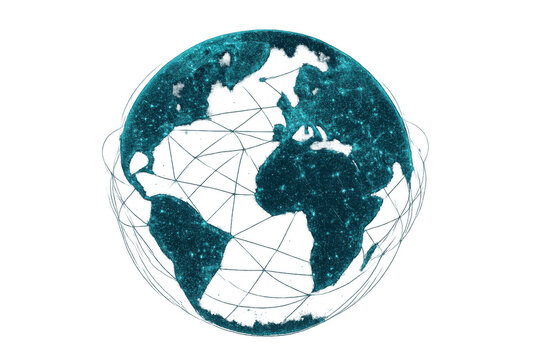
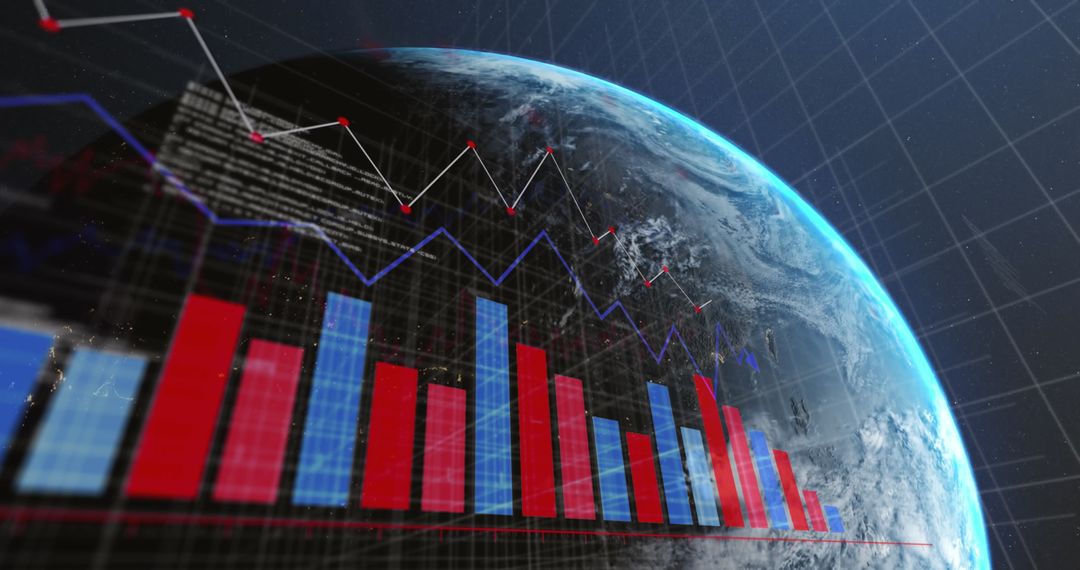
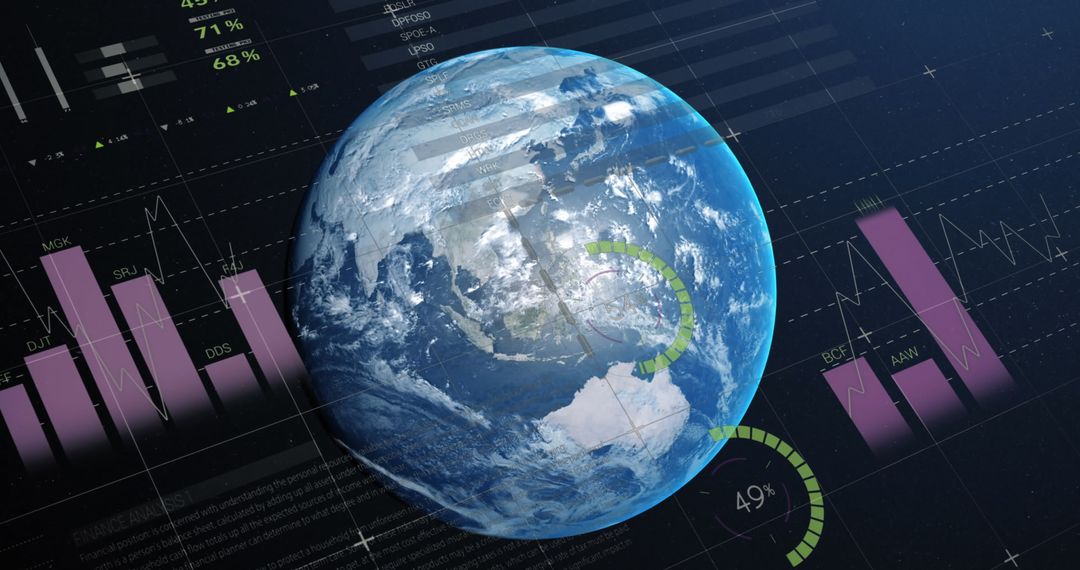
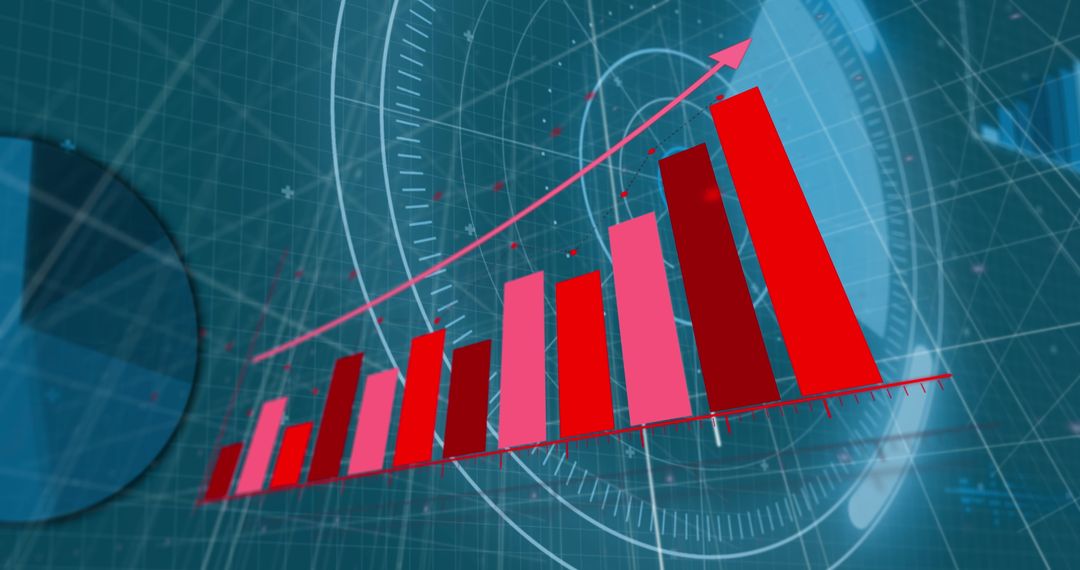
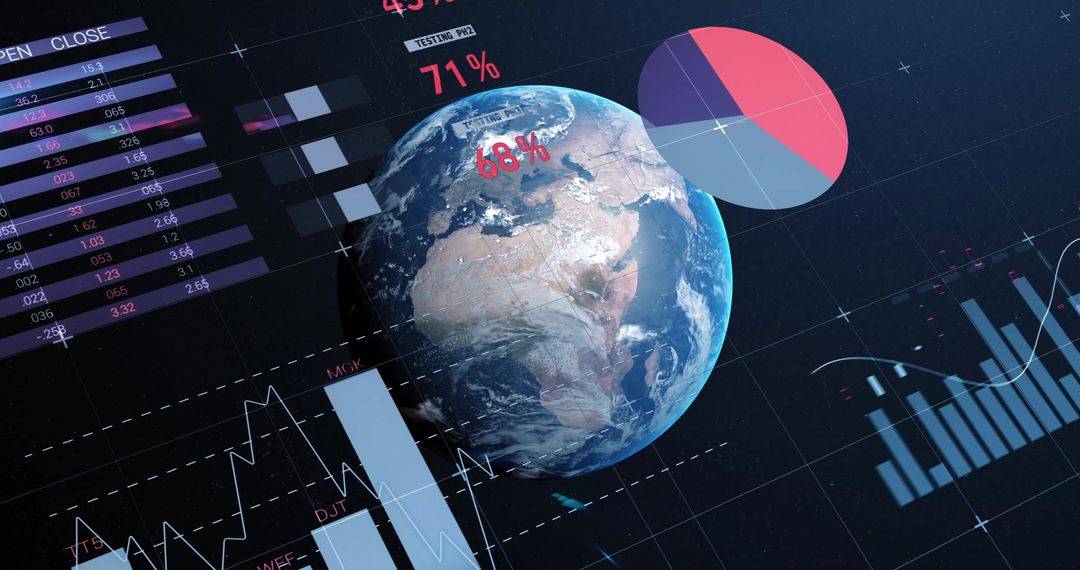
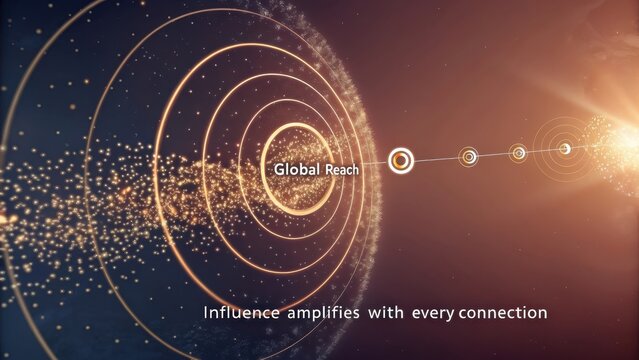
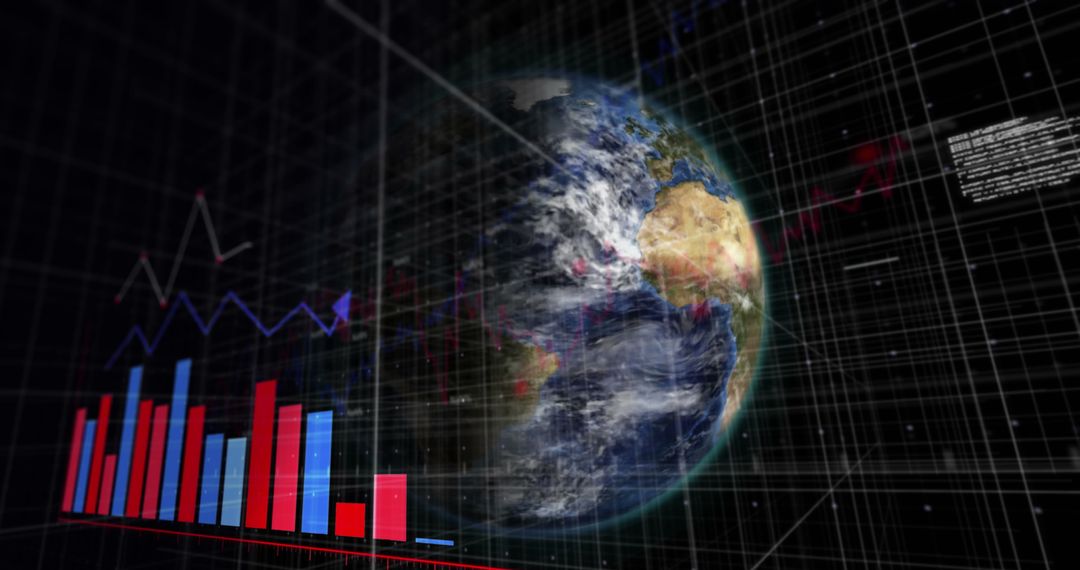
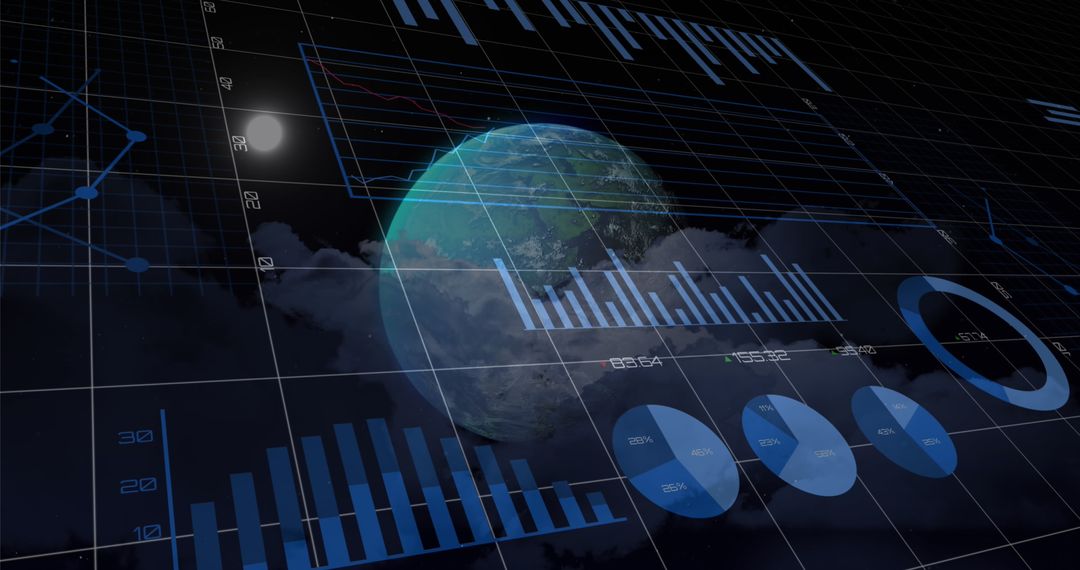
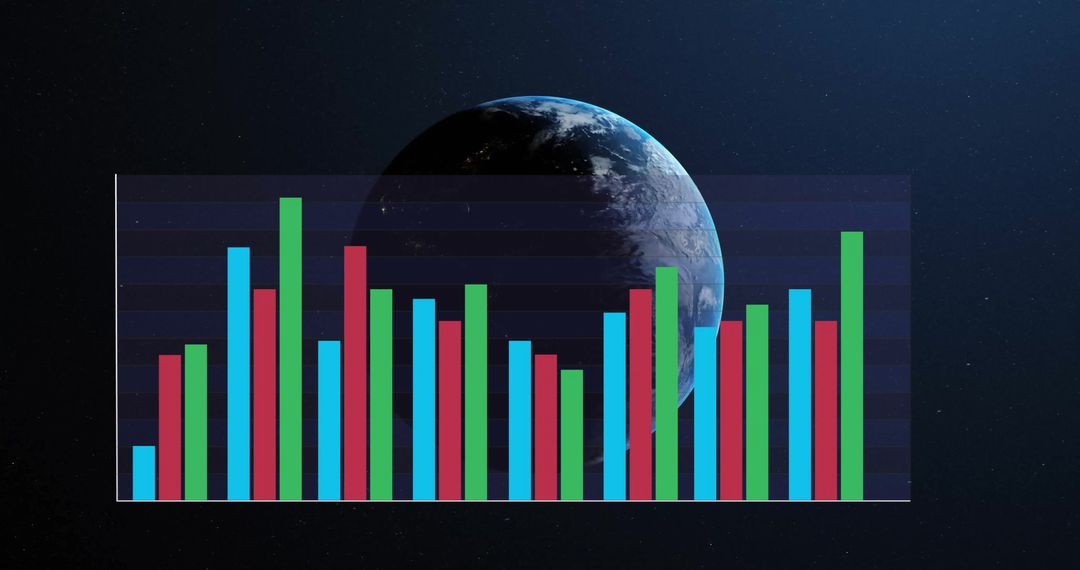
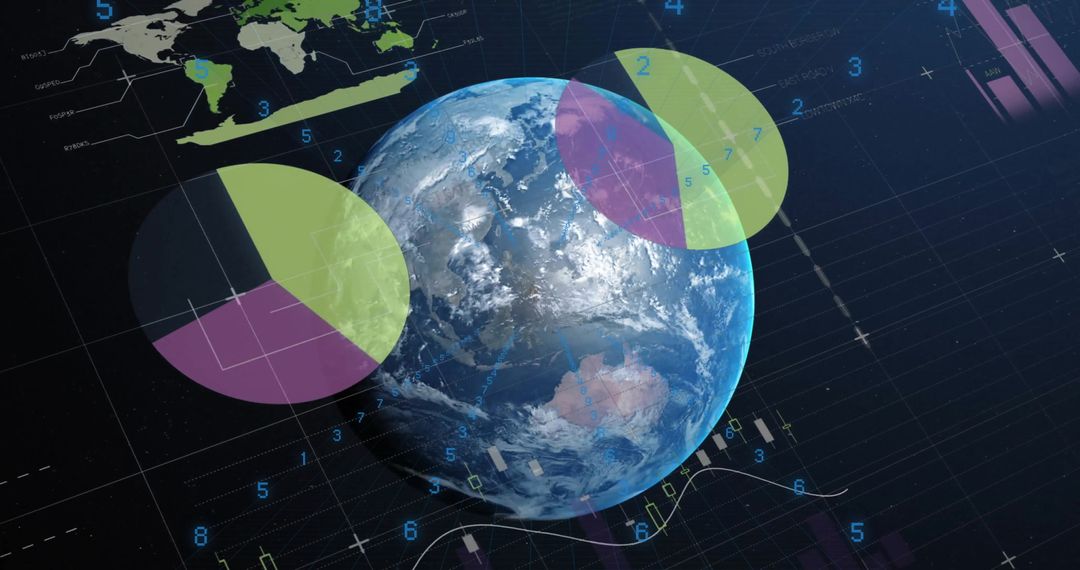
- Global Business Trends and Data Analysis
Global Business Trends and Data Analysis Image

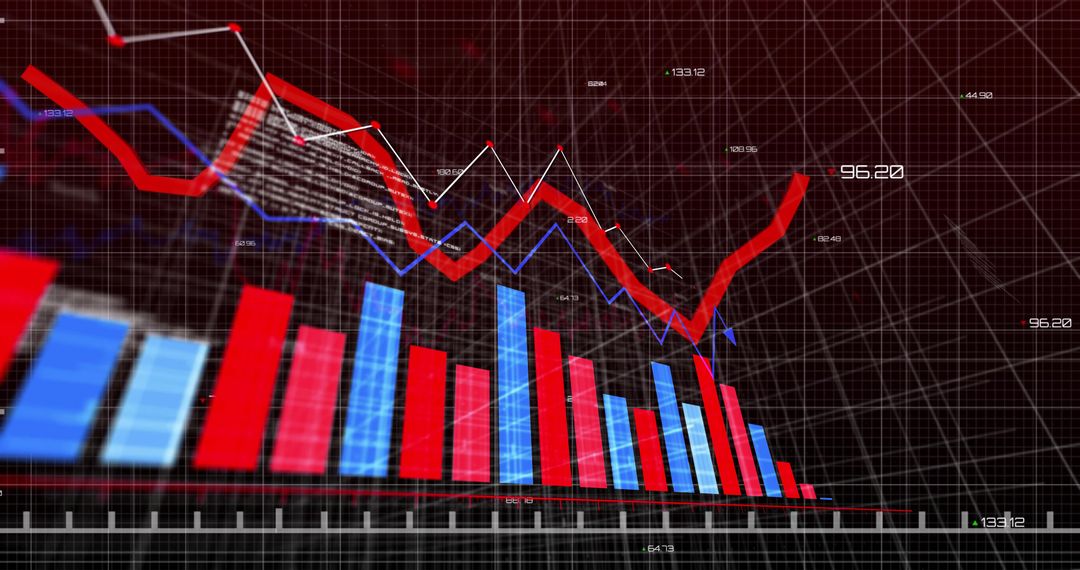
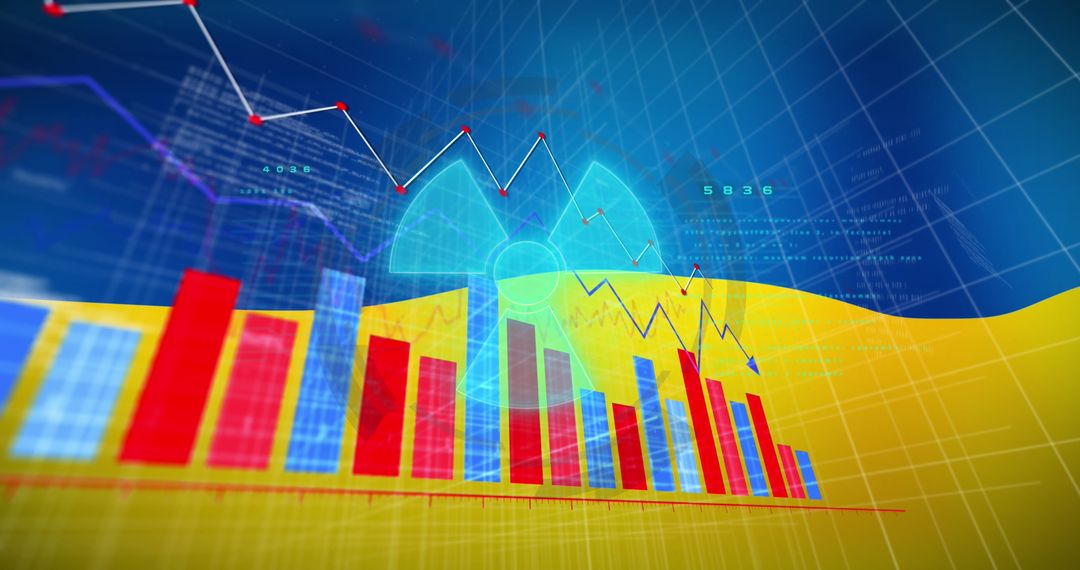
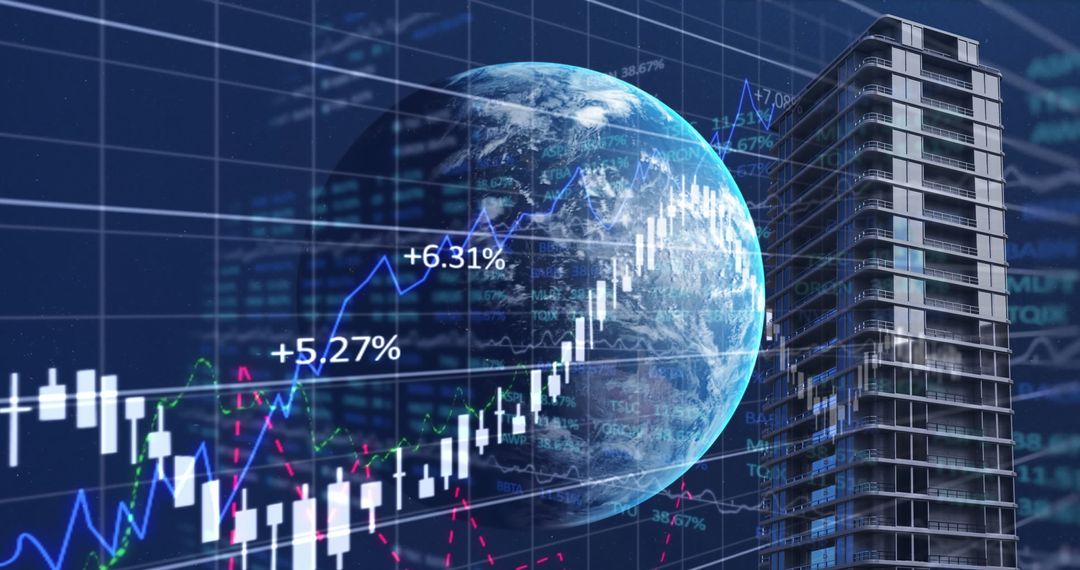
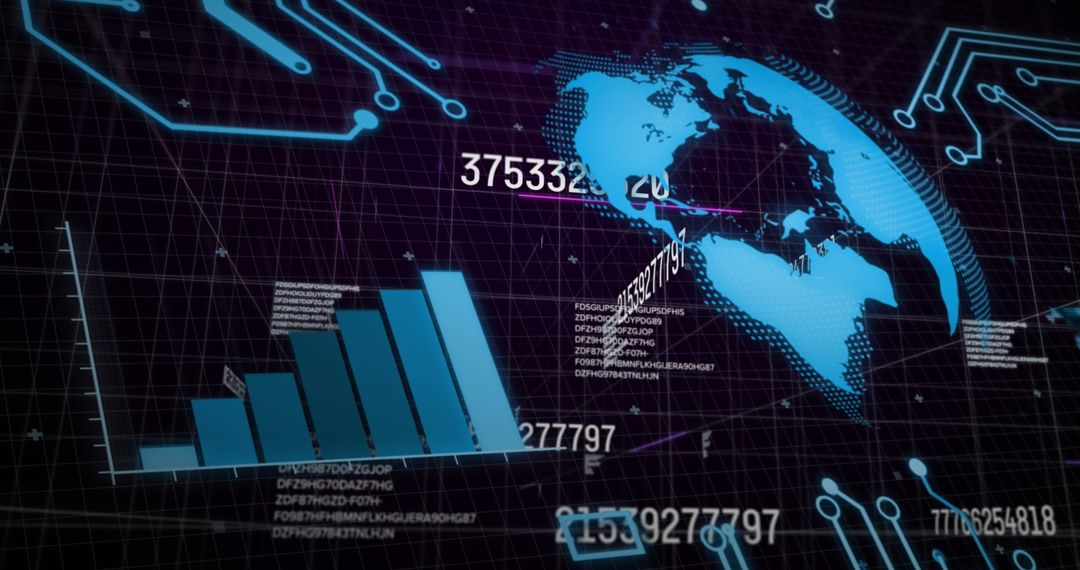
Digital composition of earth with financial data elements like bar graphs and line charts representing global business and data processing trends. Suitable for use in presentations about world economy, financial services technology, investment strategies, or data analysis initiatives. Demonstrates concepts of interconnected business influences and international market dynamics.
Powered by 


2
downloads
downloads
Tags:
More
Credit Photo
If you would like to credit the Photo, here are some ways you can do so
Text Link
photo Link
<span class="text-link">
<span>
<a target="_blank" href=https://pikwizard.com/photo/global-business-trends-and-data-analysis/358af6d823f74a02bb8ff638fab83ca7/>PikWizard</a>
</span>
</span>
<span class="image-link">
<span
style="margin: 0 0 20px 0; display: inline-block; vertical-align: middle; width: 100%;"
>
<a
target="_blank"
href="https://pikwizard.com/photo/global-business-trends-and-data-analysis/358af6d823f74a02bb8ff638fab83ca7/"
style="text-decoration: none; font-size: 10px; margin: 0;"
>
<img src="https://pikwizard.com/pw/medium/358af6d823f74a02bb8ff638fab83ca7.jpg" style="margin: 0; width: 100%;" alt="" />
<p style="font-size: 12px; margin: 0;">PikWizard</p>
</a>
</span>
</span>
Free (free of charge)
Free for personal and commercial use.
Author: People Creations
Similar Free Stock Images

Premium


Premium


Premium


Premium


Premium


Premium


Premium


Premium


Premium

Premium


Premium


Premium


Premium


Premium


Premium


Premium


Premium


Premium


Premium

Premium
Premium


Premium

Premium

Premium