- Home >
- Stock Photos >
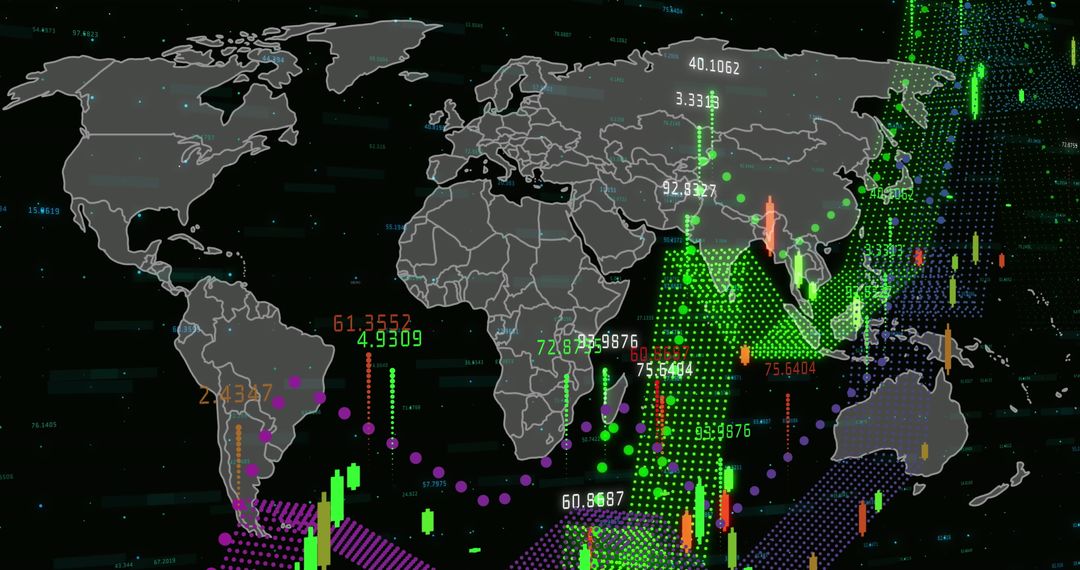
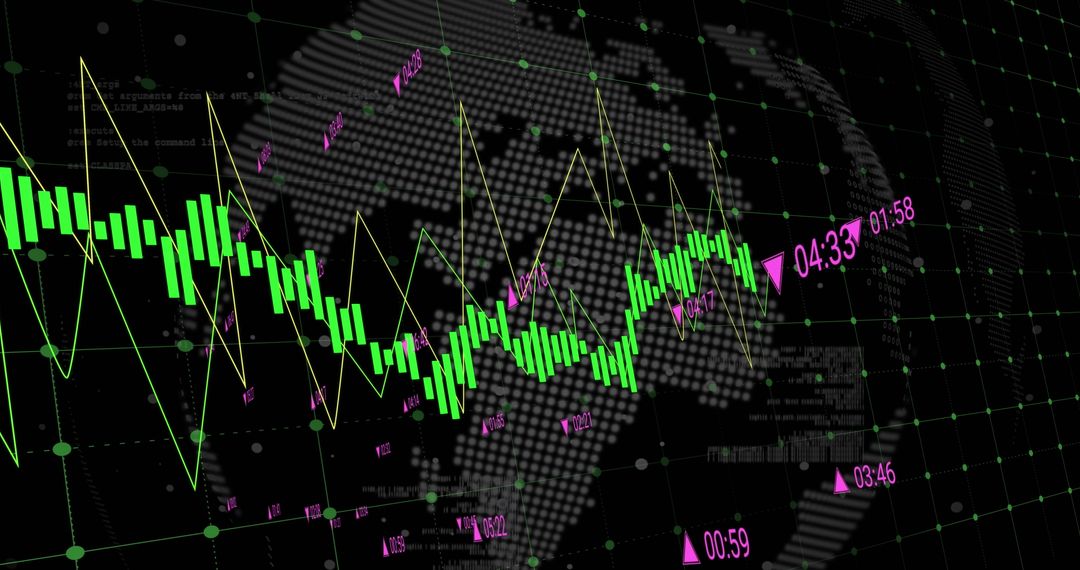
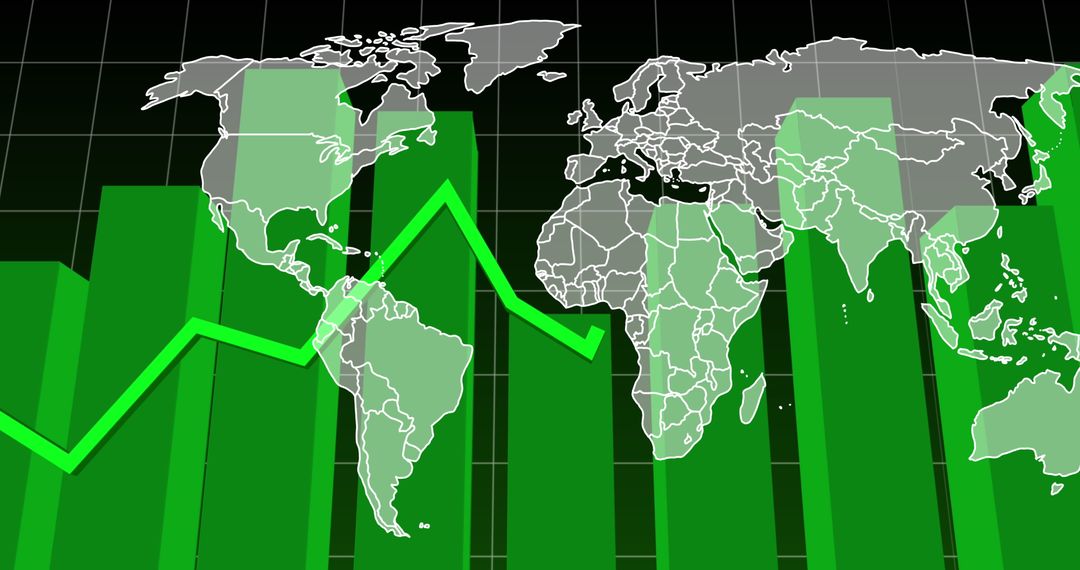
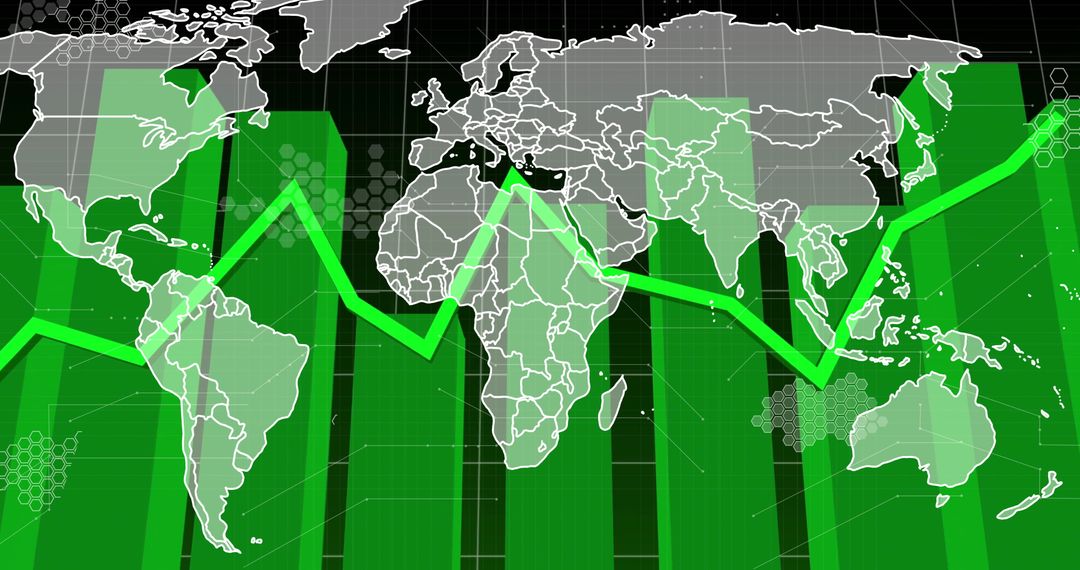
- Global Business Trends Visualization with World Map and Rising Graph
Global Business Trends Visualization with World Map and Rising Graph Image
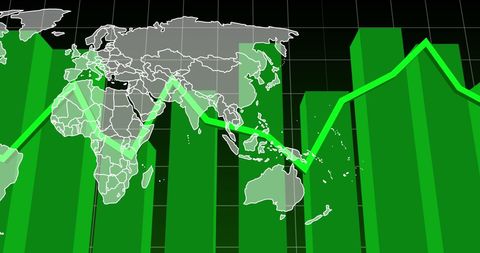
Visual representation of economic and business data showcasing global markets and growth trends. Useful for business presentations, economic reports, or digital interfaces highlighting global statistics and market analysis.
Powered by 


2
downloads
downloads
Tags:
More
Credit Photo
If you would like to credit the Photo, here are some ways you can do so
Text Link
photo Link
<span class="text-link">
<span>
<a target="_blank" href=https://pikwizard.com/photo/global-business-trends-visualization-with-world-map-and-rising-graph/041271bd57d418dd9e74a8c3c1a316d0/>PikWizard</a>
</span>
</span>
<span class="image-link">
<span
style="margin: 0 0 20px 0; display: inline-block; vertical-align: middle; width: 100%;"
>
<a
target="_blank"
href="https://pikwizard.com/photo/global-business-trends-visualization-with-world-map-and-rising-graph/041271bd57d418dd9e74a8c3c1a316d0/"
style="text-decoration: none; font-size: 10px; margin: 0;"
>
<img src="https://pikwizard.com/pw/medium/041271bd57d418dd9e74a8c3c1a316d0.jpg" style="margin: 0; width: 100%;" alt="" />
<p style="font-size: 12px; margin: 0;">PikWizard</p>
</a>
</span>
</span>
Free (free of charge)
Free for personal and commercial use.
Author: Authentic Images
Similar Free Stock Images

Premium


Premium


Premium


Premium


Premium


Premium


Premium


Premium


Premium


Premium


Premium


Premium


Premium


Premium


Premium


Premium


Premium


Premium


Premium


Premium


Premium


Premium


Premium


Premium