- Home >
- Stock Photos >
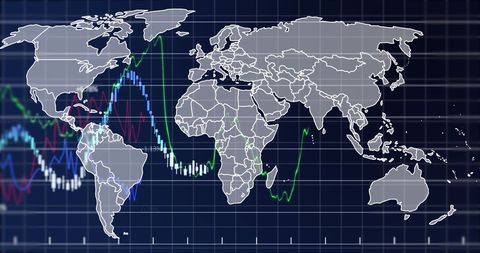
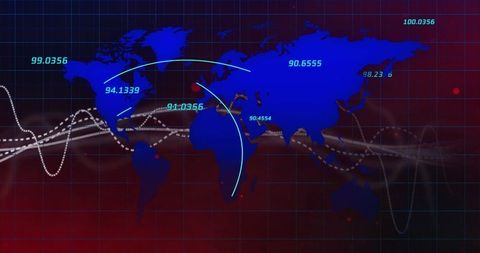
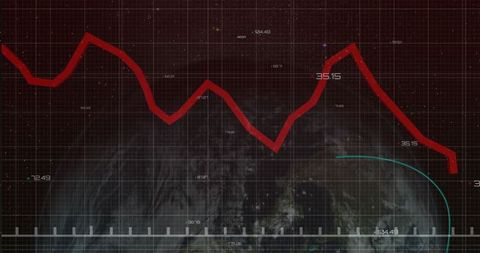
- Global Economic Trend Representation on Digital World Map
Global Economic Trend Representation on Digital World Map Image

Depicting a digital map of the world, this illustration features a red zigzagging trend line filled with numerical keys, symbolizing fluctuating economic or financial data on a global scale. This could be apt for illustrating worldwide economic reports, analytics presentations or financial trends. The technologically advanced design also makes it a perfect addition to digital reports or data analysis-based content creating a high-tech visual appeal.
Powered by  - Get 15% off with code: PIKWIZARD15


0
downloads
downloads
Tags:
More
Credit Photo
If you would like to credit the Photo, here are some ways you can do so
Text Link
photo Link
<span class="text-link">
<span>
<a target="_blank" href=https://pikwizard.com/photo/global-economic-trend-representation-on-digital-world-map/85dcbc3f9d941c029d649b3bae65d949/>PikWizard</a>
</span>
</span>
<span class="image-link">
<span
style="margin: 0 0 20px 0; display: inline-block; vertical-align: middle; width: 100%;"
>
<a
target="_blank"
href="https://pikwizard.com/photo/global-economic-trend-representation-on-digital-world-map/85dcbc3f9d941c029d649b3bae65d949/"
style="text-decoration: none; font-size: 10px; margin: 0;"
>
<img src="https://pikwizard.com/pw/medium/85dcbc3f9d941c029d649b3bae65d949.jpg" style="margin: 0; width: 100%;" alt="" />
<p style="font-size: 12px; margin: 0;">PikWizard</p>
</a>
</span>
</span>
Free (free of charge)
Free for personal and commercial use.
Author: Awesome Content
Similar Free Stock Images

Premium


Premium


Premium


Premium


Premium


Premium


Premium


Premium


Premium


Premium


Premium


Premium


Premium


Premium


Premium


Premium


Premium


Premium


Premium


Premium


Premium


Premium


Premium


Premium


Premium