- Home >
- Stock Photos >
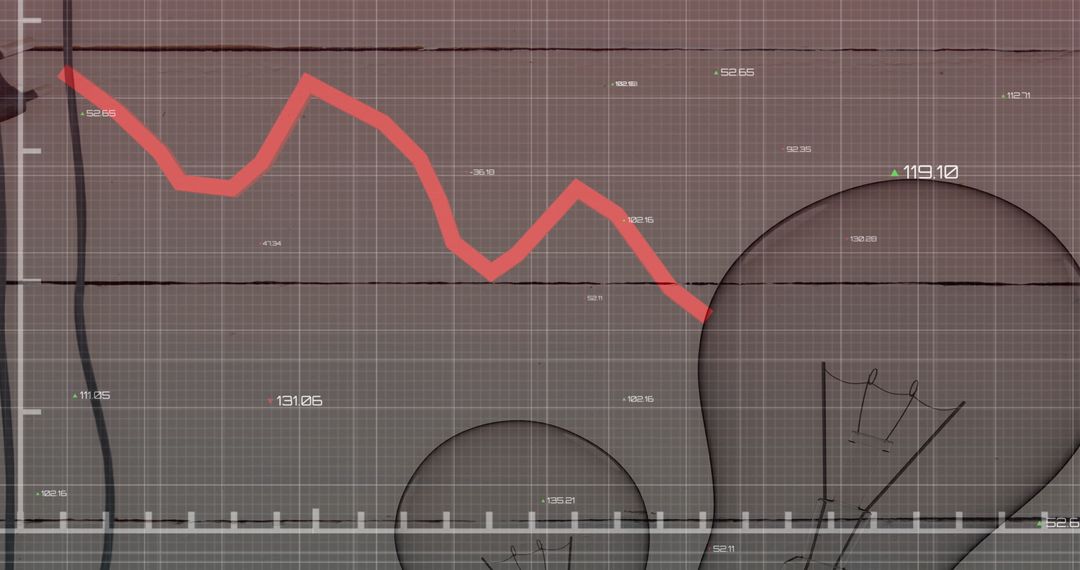
- Global Electricity Data Concept with Light Bulb and Graphs
Global Electricity Data Concept with Light Bulb and Graphs Image

Futuristic design displaying concept of global electricity consumption and data processing technology. The illuminated light bulb creates a striking image when overlaid with statistic graphs, emphasizing innovation in digital interfaces and cloud computing. Ideal for illustrating tech advancements, electricity trends, or digital transformation projects in marketing materials, websites, or educational presentations.
Powered by 


2
downloads
downloads
Tags:
More
Credit Photo
If you would like to credit the Photo, here are some ways you can do so
Text Link
photo Link
<span class="text-link">
<span>
<a target="_blank" href=https://pikwizard.com/photo/global-electricity-data-concept-with-light-bulb-and-graphs/af261829753ee24850527bbe361f566e/>PikWizard</a>
</span>
</span>
<span class="image-link">
<span
style="margin: 0 0 20px 0; display: inline-block; vertical-align: middle; width: 100%;"
>
<a
target="_blank"
href="https://pikwizard.com/photo/global-electricity-data-concept-with-light-bulb-and-graphs/af261829753ee24850527bbe361f566e/"
style="text-decoration: none; font-size: 10px; margin: 0;"
>
<img src="https://pikwizard.com/pw/medium/af261829753ee24850527bbe361f566e.jpg" style="margin: 0; width: 100%;" alt="" />
<p style="font-size: 12px; margin: 0;">PikWizard</p>
</a>
</span>
</span>
Free (free of charge)
Free for personal and commercial use.
Author: Creative Art
Similar Free Stock Images

Premium


Premium


Premium


Premium


Premium


Premium


Premium


Premium


Premium


Premium


Premium


Premium


Premium


Premium


Premium


Premium


Premium


Premium


Premium


Premium


Premium


Premium


Premium


Premium