- Home >
- Stock Photos >
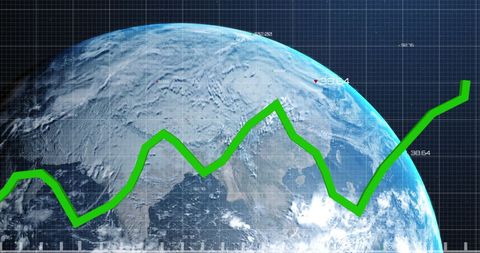
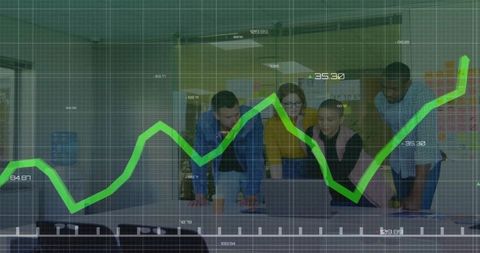
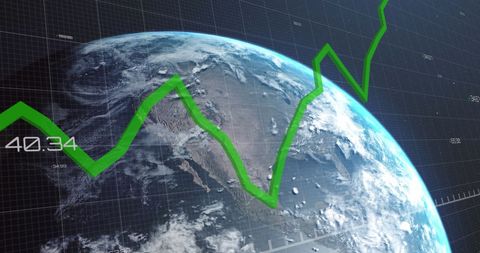
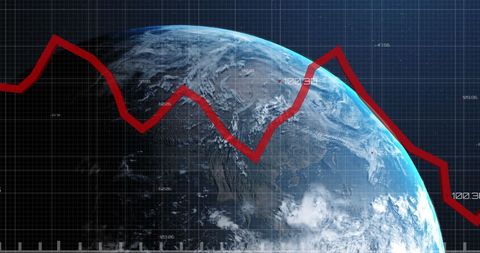
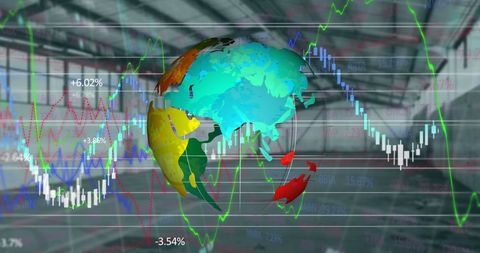
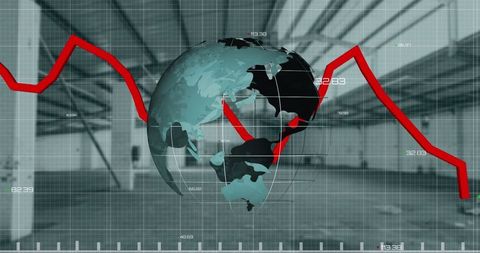
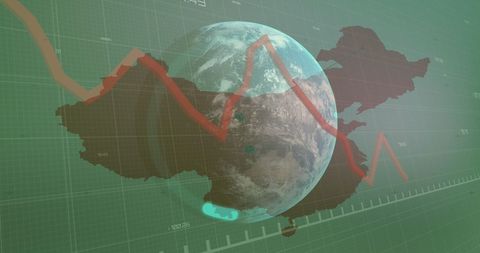
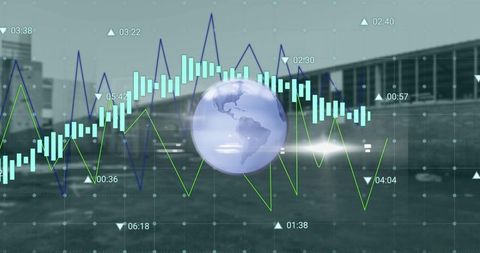
- Global Finance Concept with Graphs and Digital Globe
Global Finance Concept with Graphs and Digital Globe Image

This illustration features global financial analysis depicted through graphs overlaying a digital globe in an empty hall. The abstract representation of world market trends can be useful for financial reports, investment strategy presentations, and articles on global economic developments or market trends forecasting.
Powered by 


0
downloads
downloads
Tags:
More
Credit Photo
If you would like to credit the Photo, here are some ways you can do so
Text Link
photo Link
<span class="text-link">
<span>
<a target="_blank" href=https://pikwizard.com/photo/global-finance-concept-with-graphs-and-digital-globe/c599aa46908381d5f0055591e999b8ce/>PikWizard</a>
</span>
</span>
<span class="image-link">
<span
style="margin: 0 0 20px 0; display: inline-block; vertical-align: middle; width: 100%;"
>
<a
target="_blank"
href="https://pikwizard.com/photo/global-finance-concept-with-graphs-and-digital-globe/c599aa46908381d5f0055591e999b8ce/"
style="text-decoration: none; font-size: 10px; margin: 0;"
>
<img src="https://pikwizard.com/pw/medium/c599aa46908381d5f0055591e999b8ce.jpg" style="margin: 0; width: 100%;" alt="" />
<p style="font-size: 12px; margin: 0;">PikWizard</p>
</a>
</span>
</span>
Free (free of charge)
Free for personal and commercial use.
Author: Authentic Images
Similar Free Stock Images

Premium


Premium


Premium


Premium


Premium


Premium


Premium


Premium


Premium


Premium


Premium


Premium


Premium


Premium


Premium


Premium


Premium


Premium


Premium


Premium


Premium


Premium


Premium


Premium


Premium