- Home >
- Stock Photos >
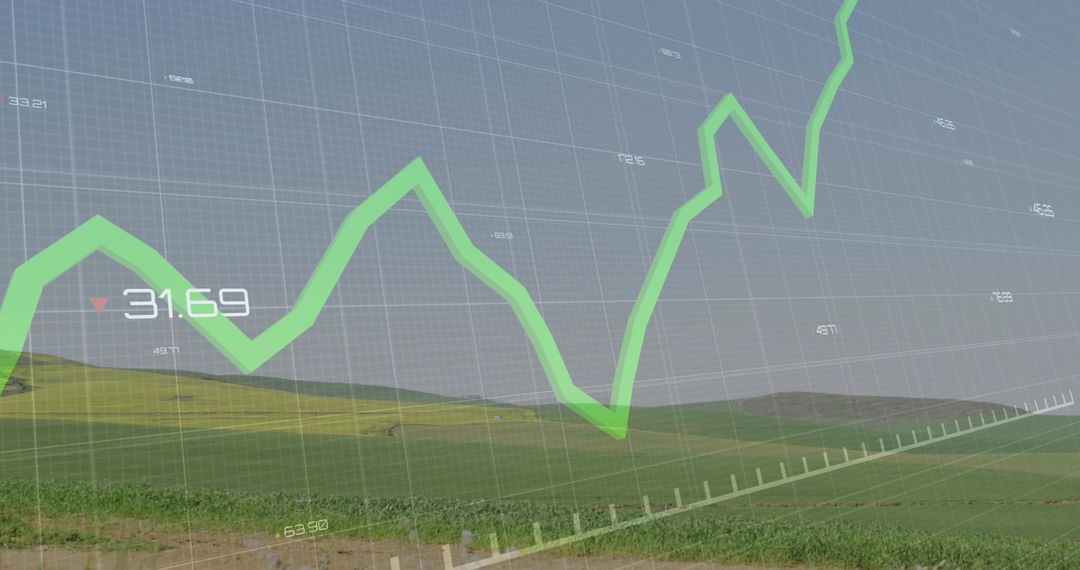
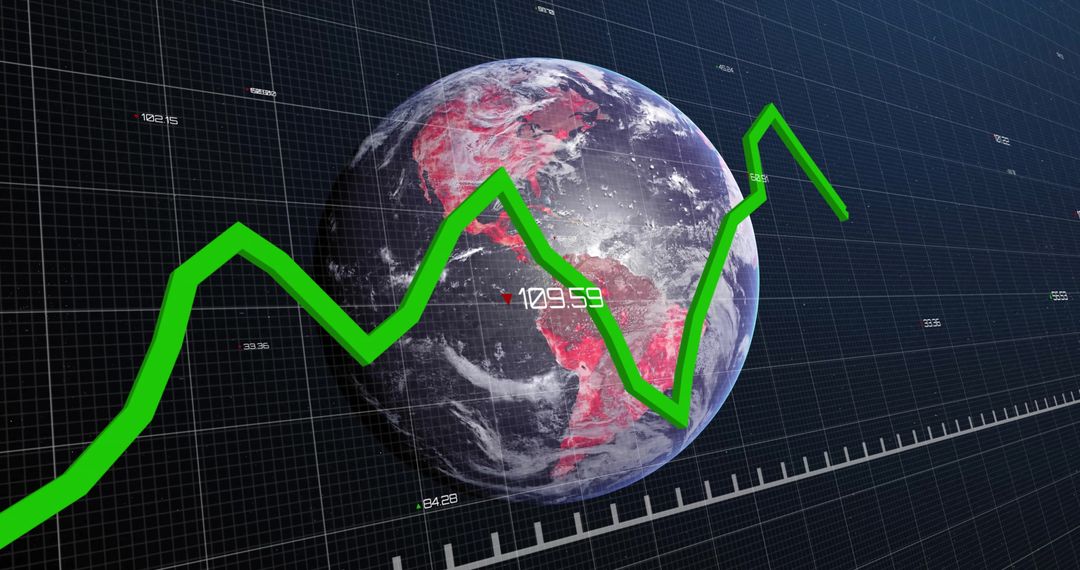
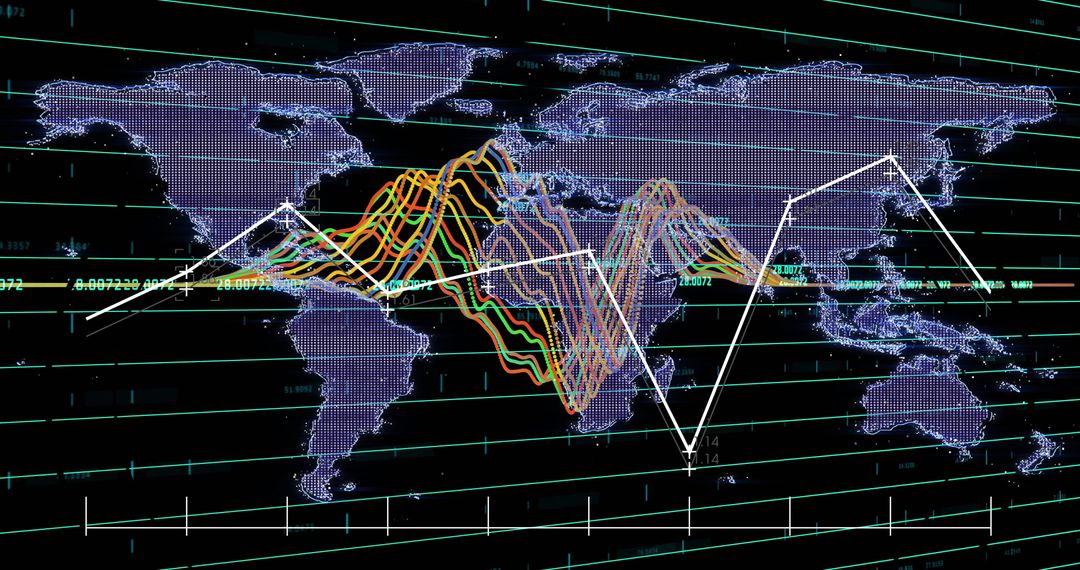
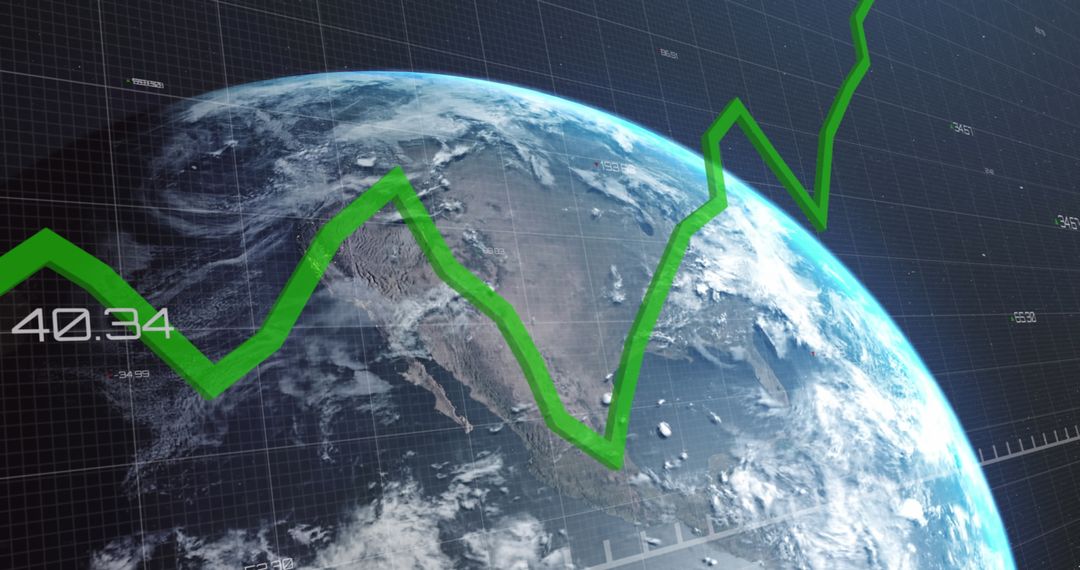
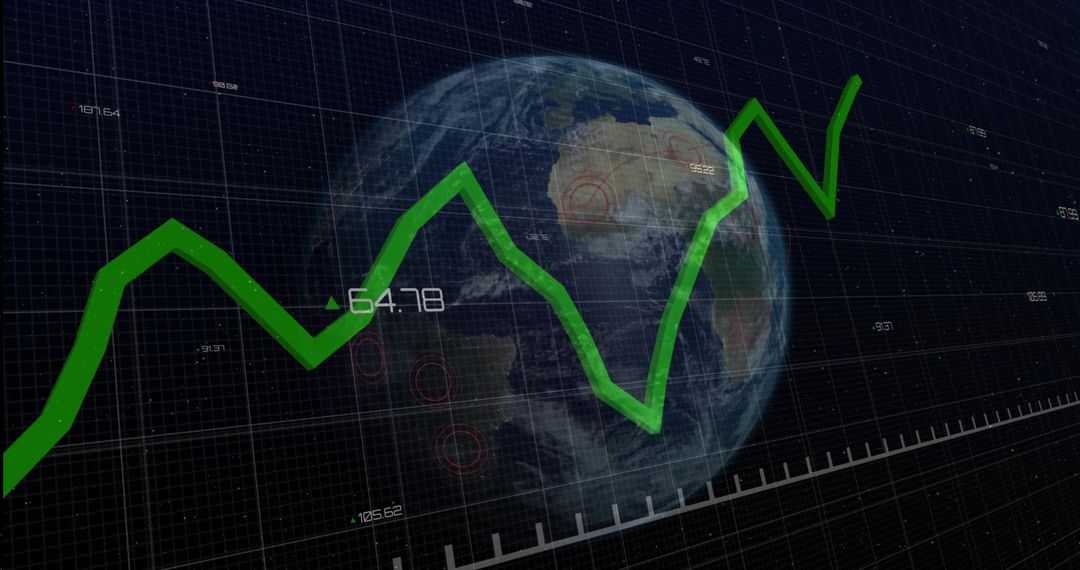
- Global Financial Analytics: Green Line Graph on Digital Globe
Global Financial Analytics: Green Line Graph on Digital Globe Image

Showing green zigzag financial graph over digital globe background on graph-like grid. Used for financial analytics, tech innovation, data visualization, global market analysis. Ideal for illustrating both global reach and specific data relevance in technology articles, finance presentations and strategy reports.
Powered by  - Get 15% off with code: PIKWIZARD15


0
downloads
downloads
Tags:
More
Credit Photo
If you would like to credit the Photo, here are some ways you can do so
Text Link
photo Link
<span class="text-link">
<span>
<a target="_blank" href=https://pikwizard.com/photo/global-financial-analytics-green-line-graph-on-digital-globe/9588602dffd9cbad1d163ad67ace9f29/>PikWizard</a>
</span>
</span>
<span class="image-link">
<span
style="margin: 0 0 20px 0; display: inline-block; vertical-align: middle; width: 100%;"
>
<a
target="_blank"
href="https://pikwizard.com/photo/global-financial-analytics-green-line-graph-on-digital-globe/9588602dffd9cbad1d163ad67ace9f29/"
style="text-decoration: none; font-size: 10px; margin: 0;"
>
<img src="https://pikwizard.com/pw/medium/9588602dffd9cbad1d163ad67ace9f29.jpg" style="margin: 0; width: 100%;" alt="" />
<p style="font-size: 12px; margin: 0;">PikWizard</p>
</a>
</span>
</span>
Free (free of charge)
Free for personal and commercial use.
Author: Awesome Content
Similar Free Stock Images

Premium


Premium


Premium


Premium


Premium


Premium


Premium


Premium


Premium


Premium


Premium


Premium


Premium


Premium


Premium


Premium


Premium


Premium


Premium


Premium


Premium


Premium


Premium


Premium