- Home >
- Stock Photos >
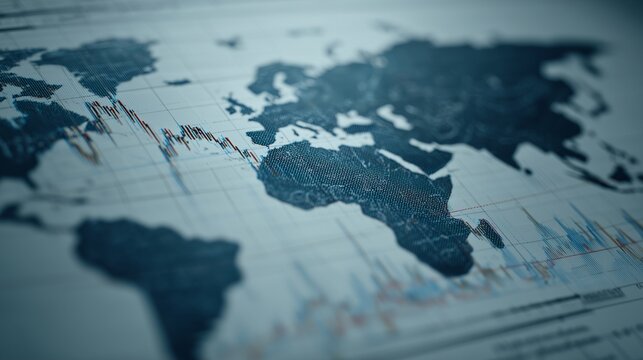
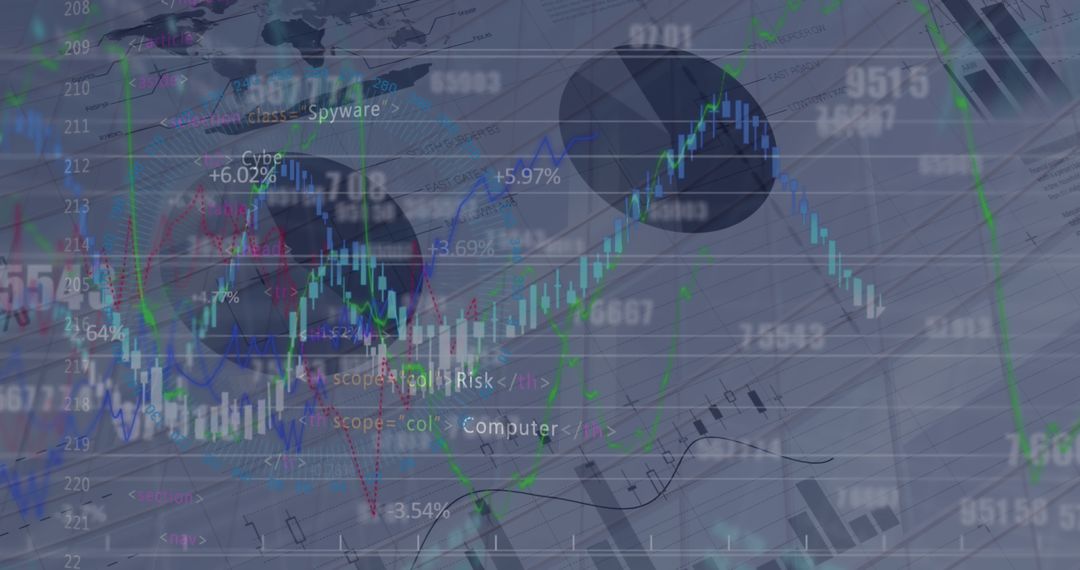
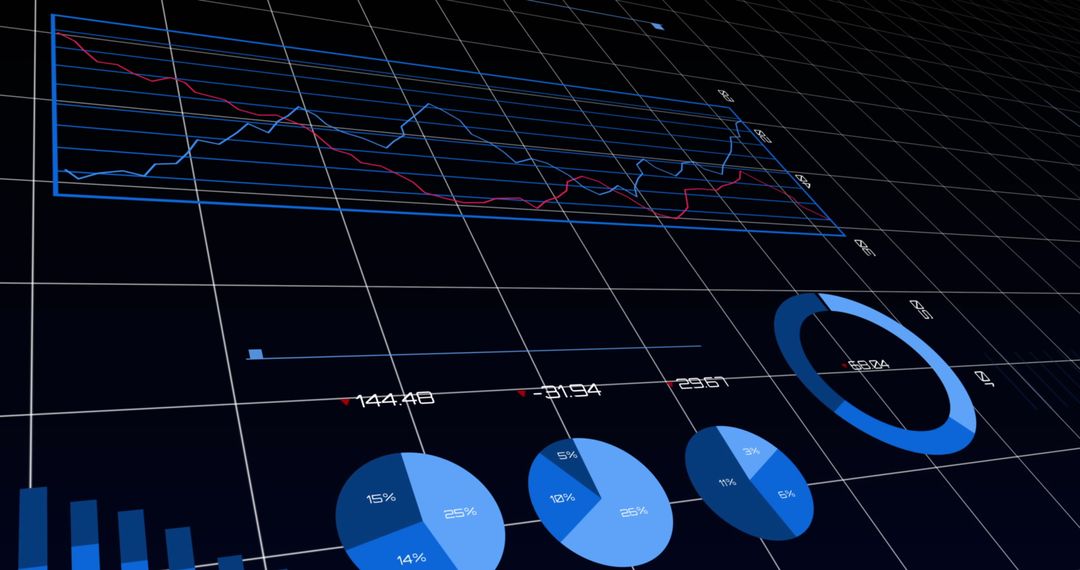
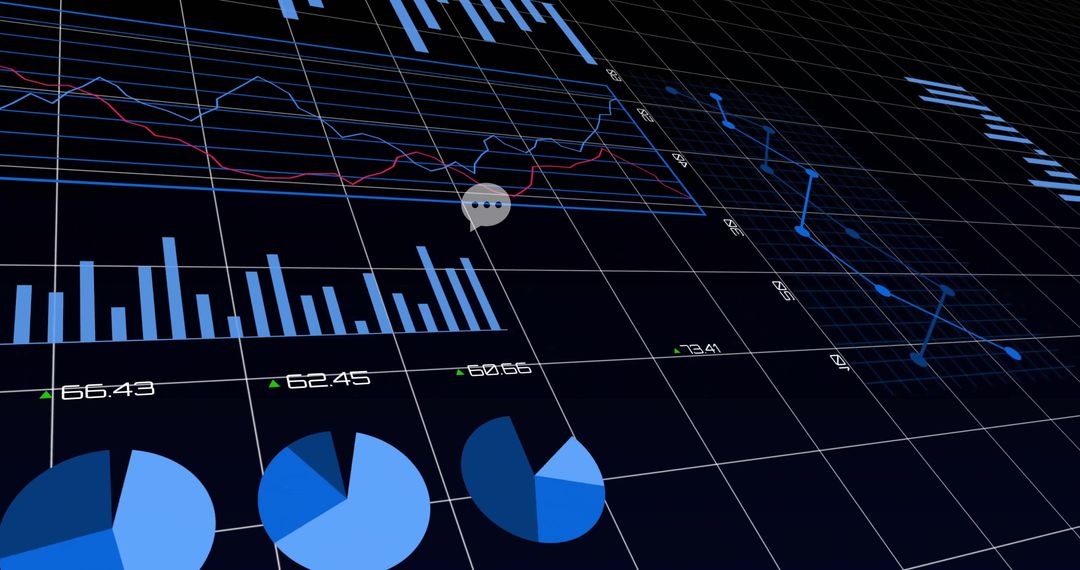
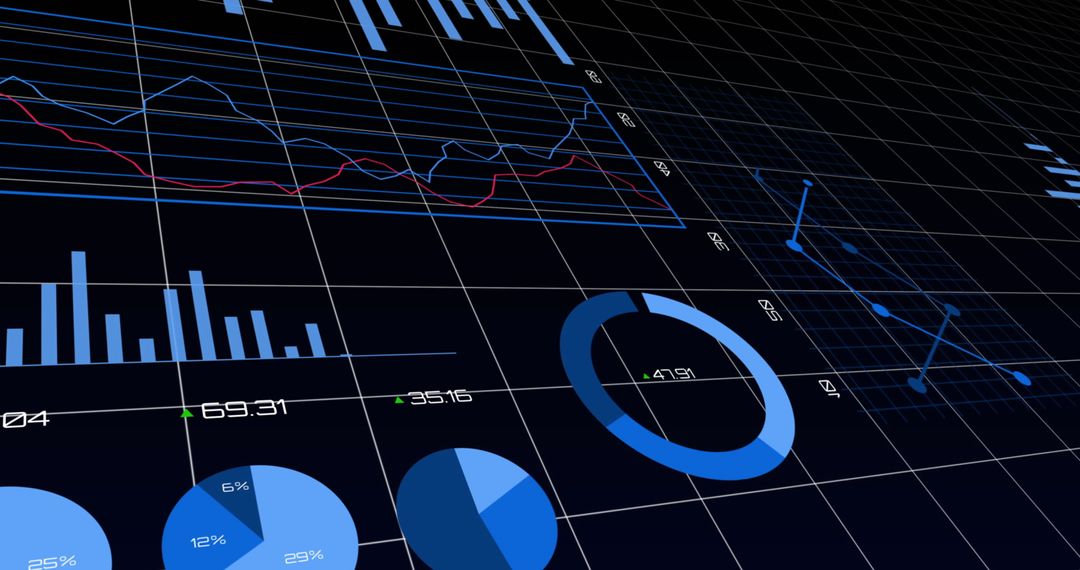
- Global Financial Charts and Digital Data Display
Global Financial Charts and Digital Data Display Image

This visual depicts an intricate web of global financial data represented through various charts and graphs on a digital display. Its dynamic and futuristic design vividly symbolizes business interconnectedness, economic expansion, and strategic planning in the modern age. Suitable for use in business presentations, financial reports, investment seminars, or educational materials, it enhances presentations that focus on financial trends and global marketplace analytics.
Powered by 


0
downloads
downloads
Tags:
More
Credit Photo
If you would like to credit the Photo, here are some ways you can do so
Text Link
photo Link
<span class="text-link">
<span>
<a target="_blank" href=https://pikwizard.com/photo/global-financial-charts-and-digital-data-display/1e9c2a713bc0c65c49b1cc2c244dc752/>PikWizard</a>
</span>
</span>
<span class="image-link">
<span
style="margin: 0 0 20px 0; display: inline-block; vertical-align: middle; width: 100%;"
>
<a
target="_blank"
href="https://pikwizard.com/photo/global-financial-charts-and-digital-data-display/1e9c2a713bc0c65c49b1cc2c244dc752/"
style="text-decoration: none; font-size: 10px; margin: 0;"
>
<img src="https://pikwizard.com/pw/medium/1e9c2a713bc0c65c49b1cc2c244dc752.jpg" style="margin: 0; width: 100%;" alt="" />
<p style="font-size: 12px; margin: 0;">PikWizard</p>
</a>
</span>
</span>
Free (free of charge)
Free for personal and commercial use.
Author: Awesome Content
Similar Free Stock Images

Premium


Premium


Premium


Premium


Premium


Premium


Premium


Premium


Premium


Premium


Premium


Premium


Premium


Premium


Premium


Premium


Premium


Premium


Premium


Premium


Premium


Premium


Premium


Premium


Premium