- Home >
- Stock Photos >
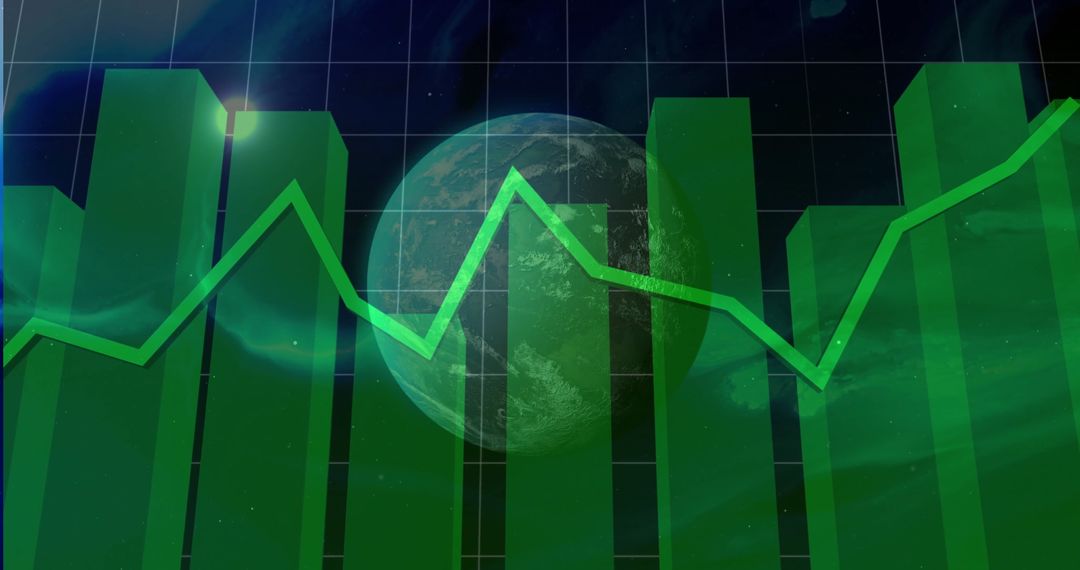
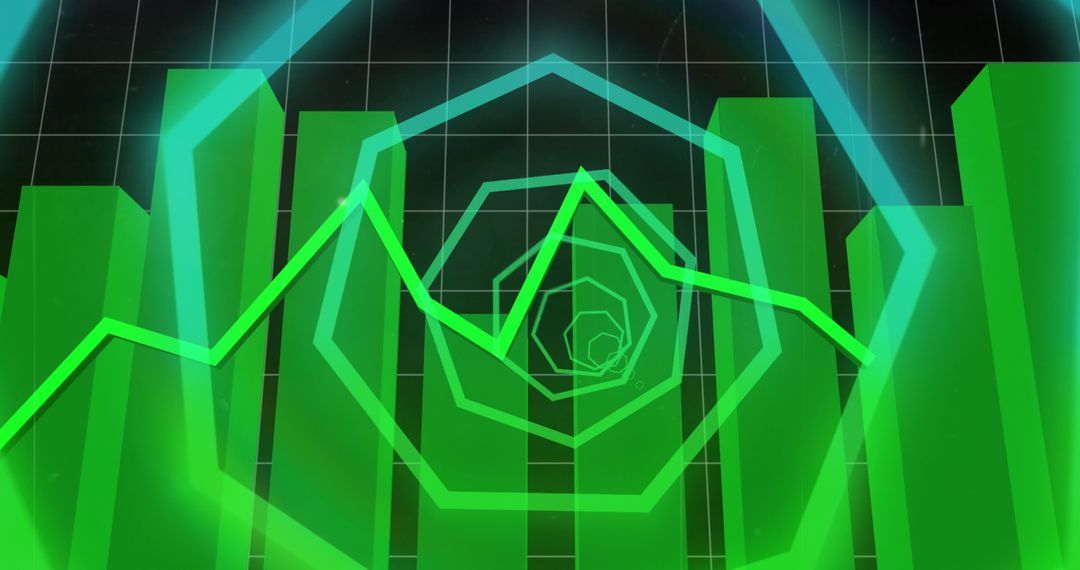
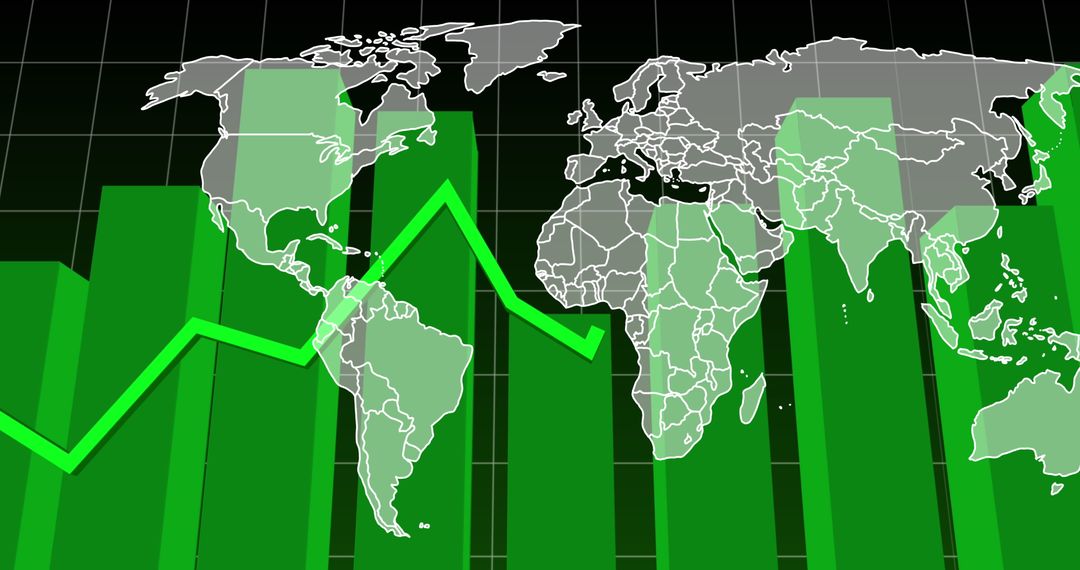
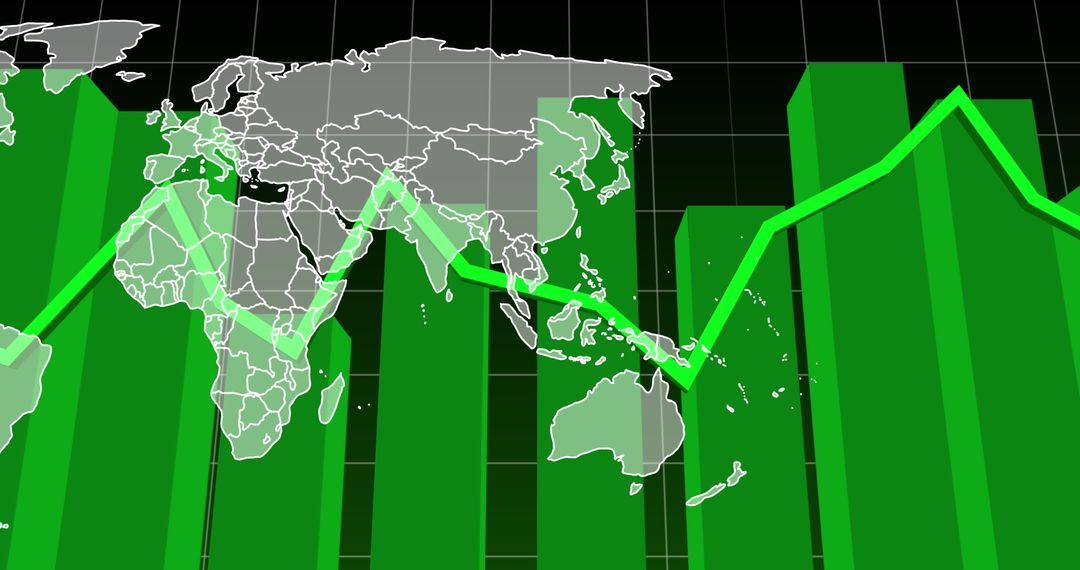
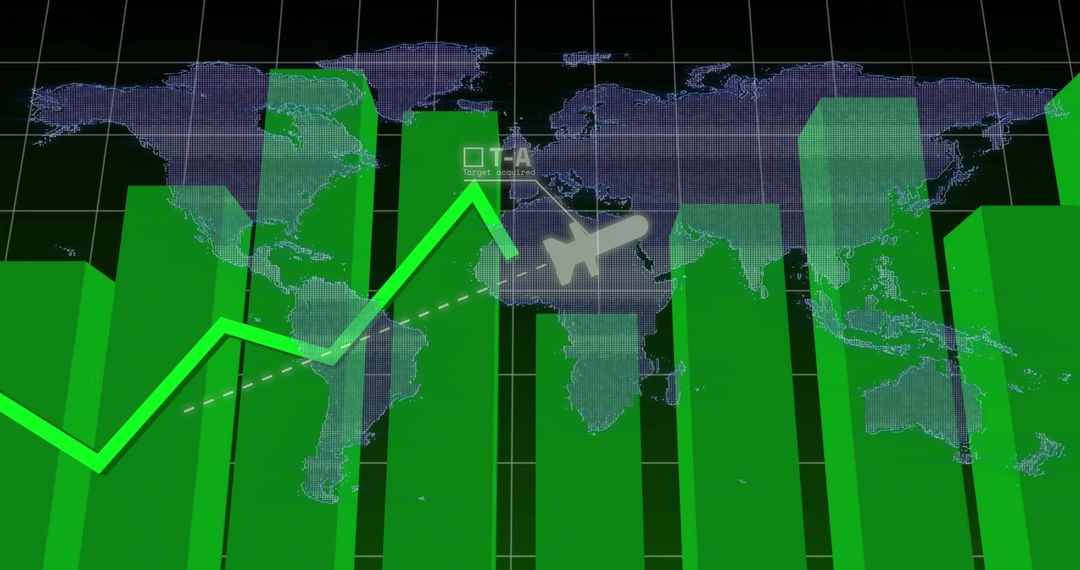
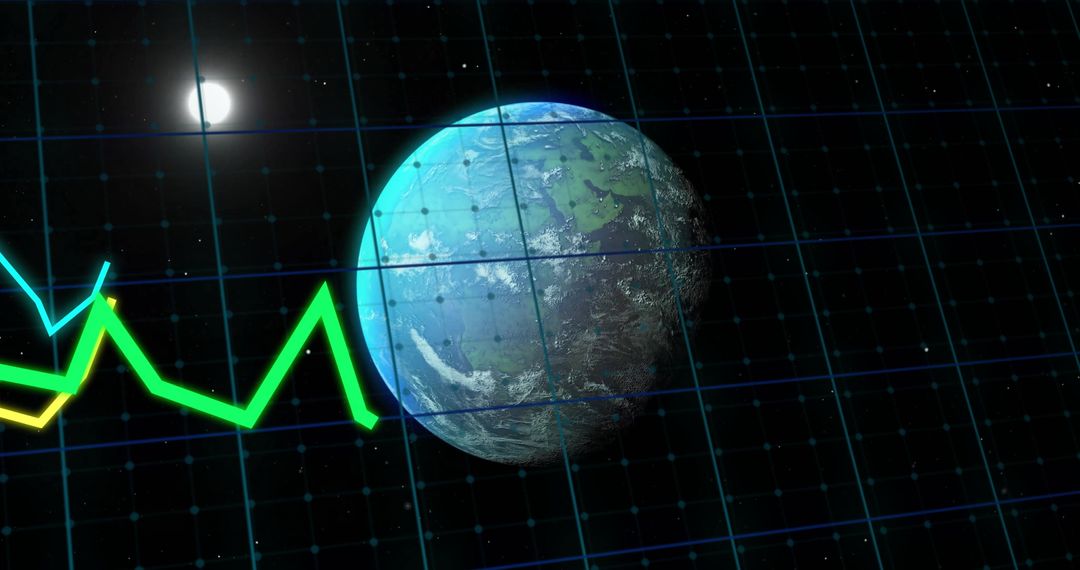
- Global financial dashboard showing green 3D bar chart and neon line graph over Earth
Global financial dashboard showing green 3D bar chart and neon line graph over Earth Image

Showing green 3D bar chart and neon line graph overlaying globe and grid, conveying global finance analytics and market performance. Featuring translucent bars, glowing trend line, network icons, and subtle data streams for futuristic digital feel. Suiting fintech websites, investment presentations, annual reports, data analytics blog posts, business pitch decks, and social media campaigns. Color palette using deep greens and neon accents, suggesting growth, sustainability, and high-tech innovation. Providing space for headline and call-to-action overlays, ideal for hero banners, slide backgrounds, and promotional materials.
Powered by  - Get 15% off with code: PIKWIZARD15


0
downloads
downloads
Tags:
More
Credit Photo
If you would like to credit the Photo, here are some ways you can do so
Text Link
photo Link
<span class="text-link">
<span>
<a target="_blank" href=https://pikwizard.com/photo/global-financial-dashboard-showing-green-3d-bar-chart-and-neon-line-graph-over-earth/4098d68b766846c18e09c6afcf3d4da6/>PikWizard</a>
</span>
</span>
<span class="image-link">
<span
style="margin: 0 0 20px 0; display: inline-block; vertical-align: middle; width: 100%;"
>
<a
target="_blank"
href="https://pikwizard.com/photo/global-financial-dashboard-showing-green-3d-bar-chart-and-neon-line-graph-over-earth/4098d68b766846c18e09c6afcf3d4da6/"
style="text-decoration: none; font-size: 10px; margin: 0;"
>
<img src="https://pikwizard.com/pw/medium/4098d68b766846c18e09c6afcf3d4da6.jpg" style="margin: 0; width: 100%;" alt="" />
<p style="font-size: 12px; margin: 0;">PikWizard</p>
</a>
</span>
</span>
Free (free of charge)
Free for personal and commercial use.
Author: Authentic Images
Similar Free Stock Images

Premium


Premium


Premium


Premium


Premium


Premium


Premium


Premium


Premium


Premium


Premium


Premium


Premium


Premium


Premium


Premium


Premium


Premium


Premium


Premium


Premium


Premium


Premium


Premium