- Home >
- Stock Photos >
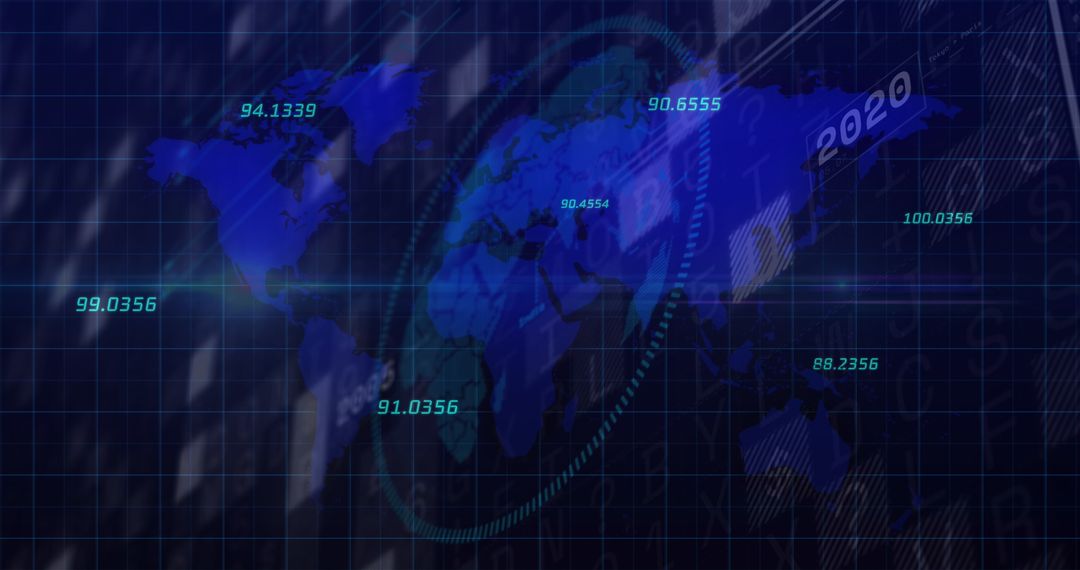
- Global Financial Data and Graphs Over Digital Globe Interface
Global Financial Data and Graphs Over Digital Globe Interface Image

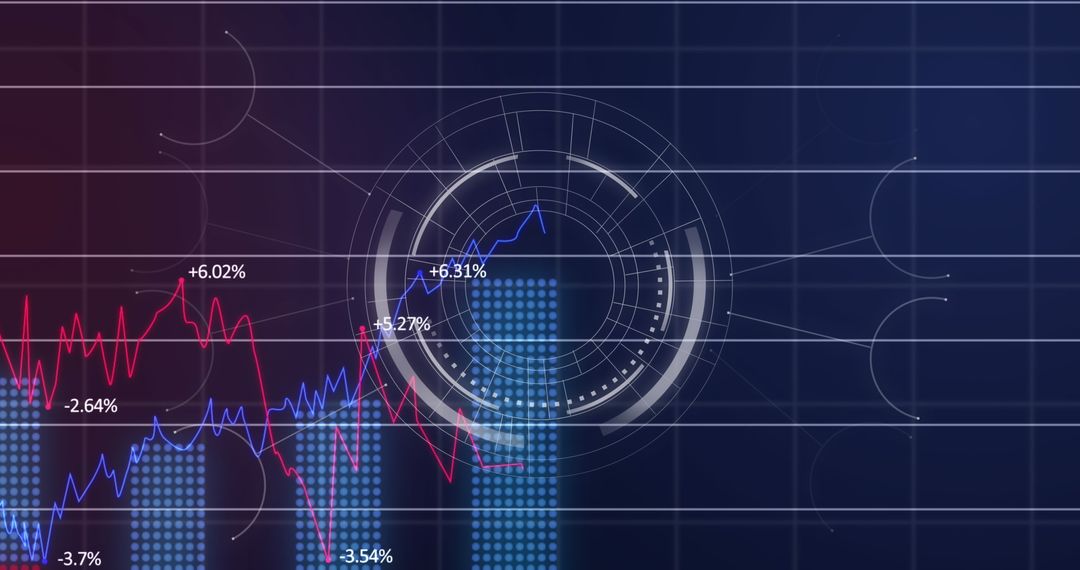
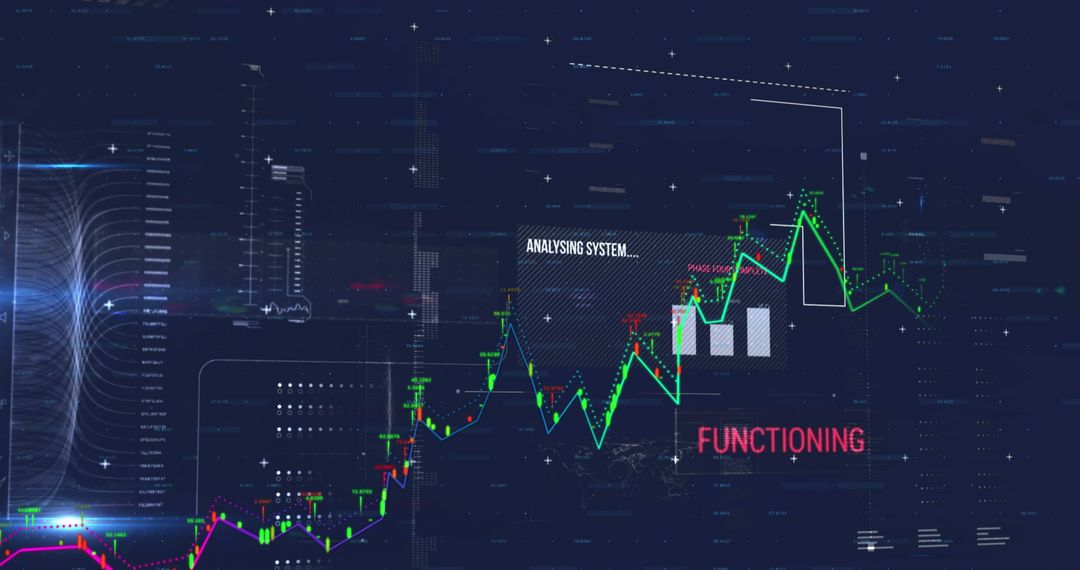
Dynamic display of financial data and graphs over a digital globe interface represents the connectivity of global finance and economy. Trend lines, statistics, and geospatial elements convey modern technological business strategies. Ideal for financial presentations, business analyses, economic reports, technology media, and educational materials about global trade.
Powered by 


2
downloads
downloads
Tags:
More
Credit Photo
If you would like to credit the Photo, here are some ways you can do so
Text Link
photo Link
<span class="text-link">
<span>
<a target="_blank" href=https://pikwizard.com/photo/global-financial-data-and-graphs-over-digital-globe-interface/c61a1bb702183b5057457083267b19f1/>PikWizard</a>
</span>
</span>
<span class="image-link">
<span
style="margin: 0 0 20px 0; display: inline-block; vertical-align: middle; width: 100%;"
>
<a
target="_blank"
href="https://pikwizard.com/photo/global-financial-data-and-graphs-over-digital-globe-interface/c61a1bb702183b5057457083267b19f1/"
style="text-decoration: none; font-size: 10px; margin: 0;"
>
<img src="https://pikwizard.com/pw/medium/c61a1bb702183b5057457083267b19f1.jpg" style="margin: 0; width: 100%;" alt="" />
<p style="font-size: 12px; margin: 0;">PikWizard</p>
</a>
</span>
</span>
Free (free of charge)
Free for personal and commercial use.
Author: Awesome Content
Similar Free Stock Images

Premium


Premium


Premium


Premium


Premium


Premium


Premium


Premium


Premium


Premium


Premium


Premium


Premium


Premium


Premium


Premium


Premium


Premium


Premium


Premium


Premium


Premium


Premium


Premium