- Home >
- Stock Photos >
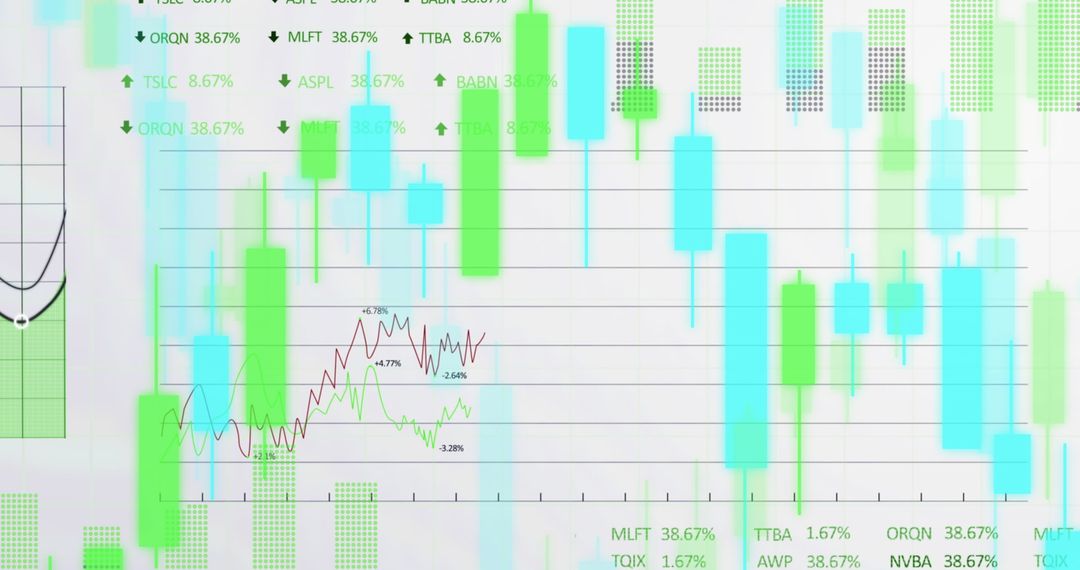
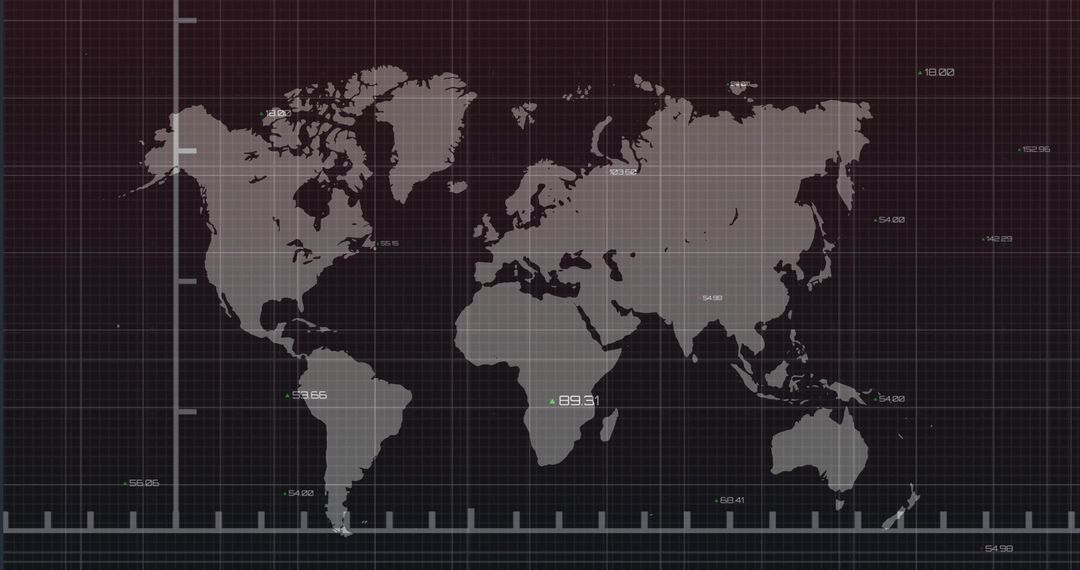
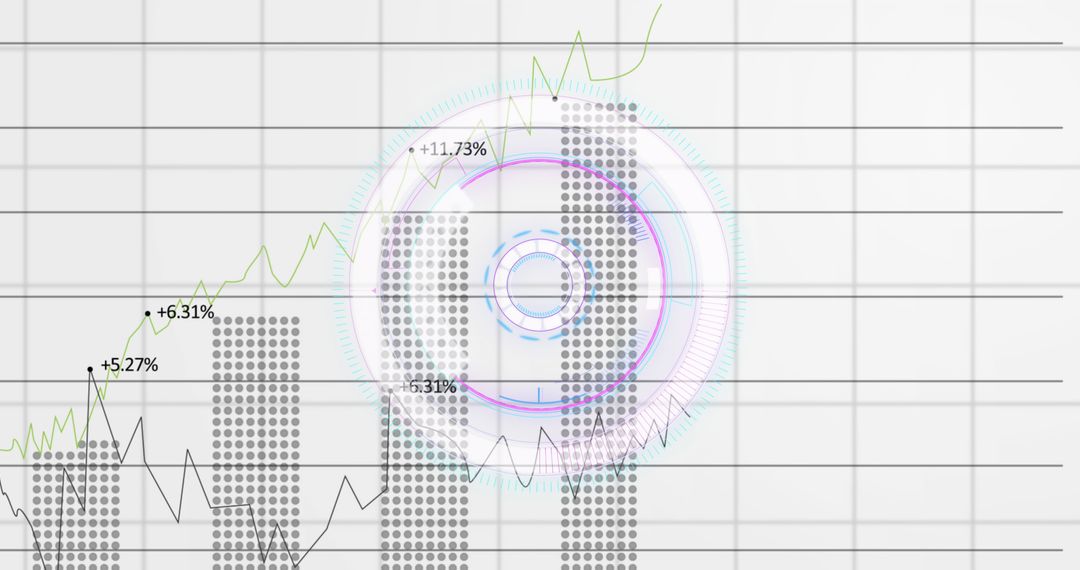
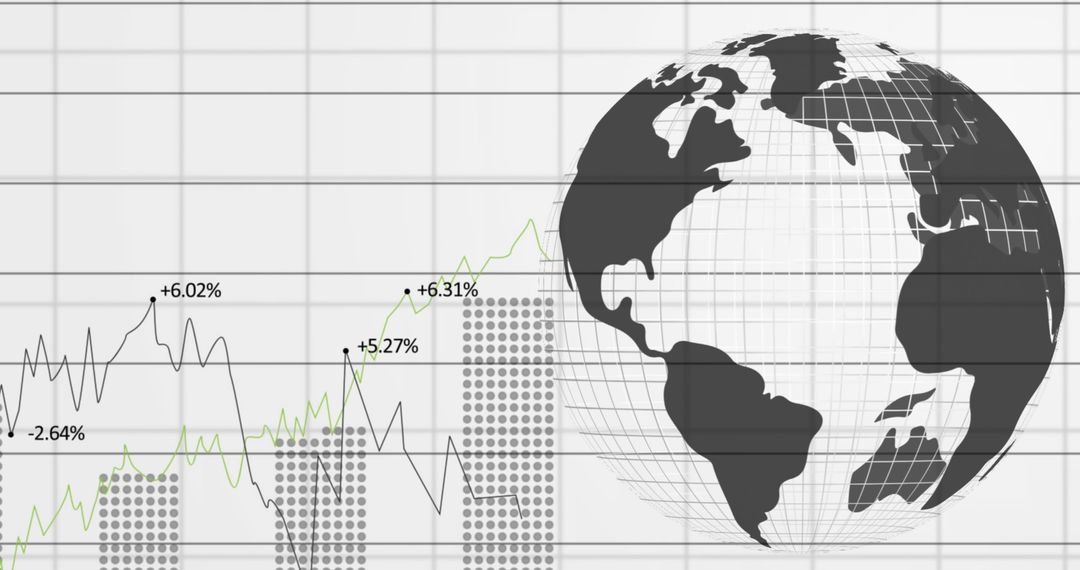
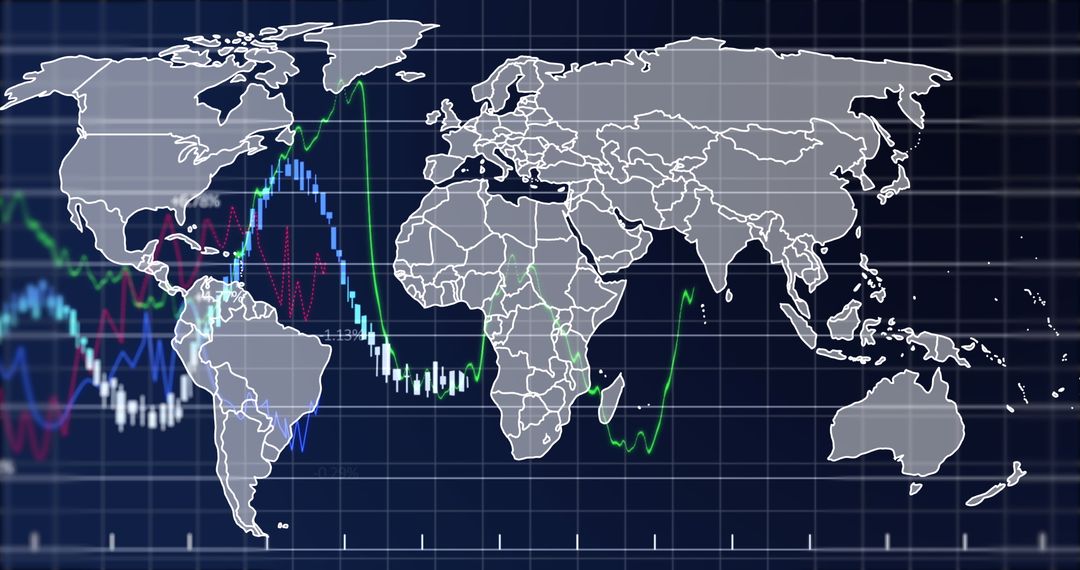
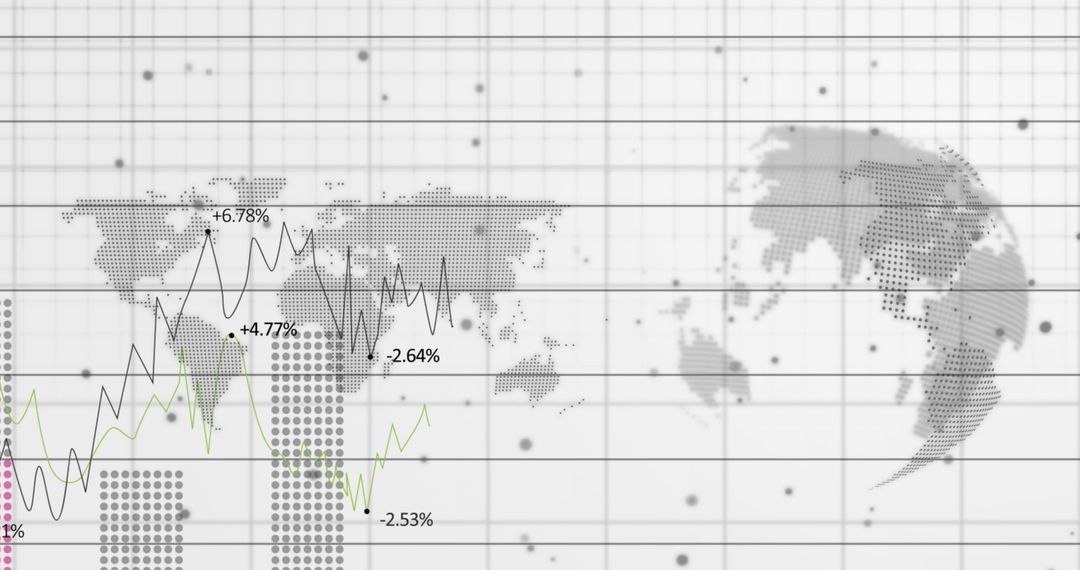
- Global Financial Data and Trends on World Map
Global Financial Data and Trends on World Map Image
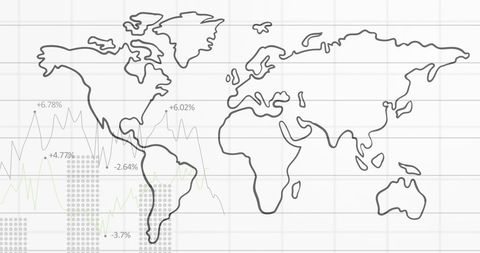
Design overlays world map with financial data and growth percentages against grid backdrop. Useful for presentations on international economic trends, global marketing strategies, and financial analysis reports. Ideal for illustrating economic studies and international business planning.
Powered by 


2
downloads
downloads
Tags:
More
Credit Photo
If you would like to credit the Photo, here are some ways you can do so
Text Link
photo Link
<span class="text-link">
<span>
<a target="_blank" href=https://pikwizard.com/photo/global-financial-data-and-trends-on-world-map/fbc74f4ab87e2b89826c3f6705c740d7/>PikWizard</a>
</span>
</span>
<span class="image-link">
<span
style="margin: 0 0 20px 0; display: inline-block; vertical-align: middle; width: 100%;"
>
<a
target="_blank"
href="https://pikwizard.com/photo/global-financial-data-and-trends-on-world-map/fbc74f4ab87e2b89826c3f6705c740d7/"
style="text-decoration: none; font-size: 10px; margin: 0;"
>
<img src="https://pikwizard.com/pw/medium/fbc74f4ab87e2b89826c3f6705c740d7.jpg" style="margin: 0; width: 100%;" alt="" />
<p style="font-size: 12px; margin: 0;">PikWizard</p>
</a>
</span>
</span>
Free (free of charge)
Free for personal and commercial use.
Author: Awesome Content
Similar Free Stock Images

Premium


Premium


Premium


Premium


Premium


Premium


Premium


Premium


Premium


Premium


Premium


Premium


Premium


Premium


Premium


Premium


Premium


Premium


Premium


Premium


Premium


Premium


Premium


Premium