- Home >
- Stock Photos >
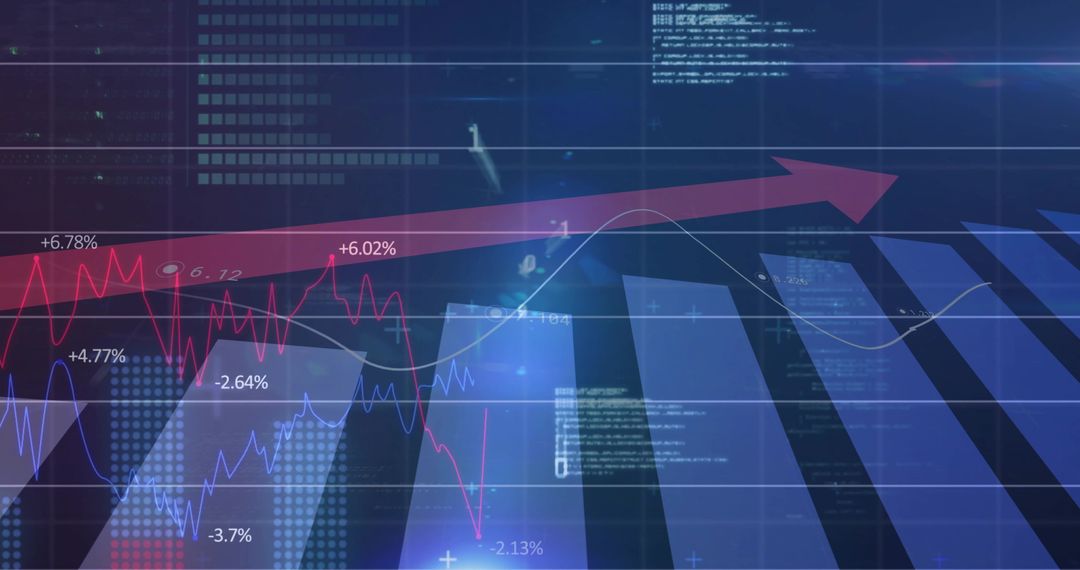
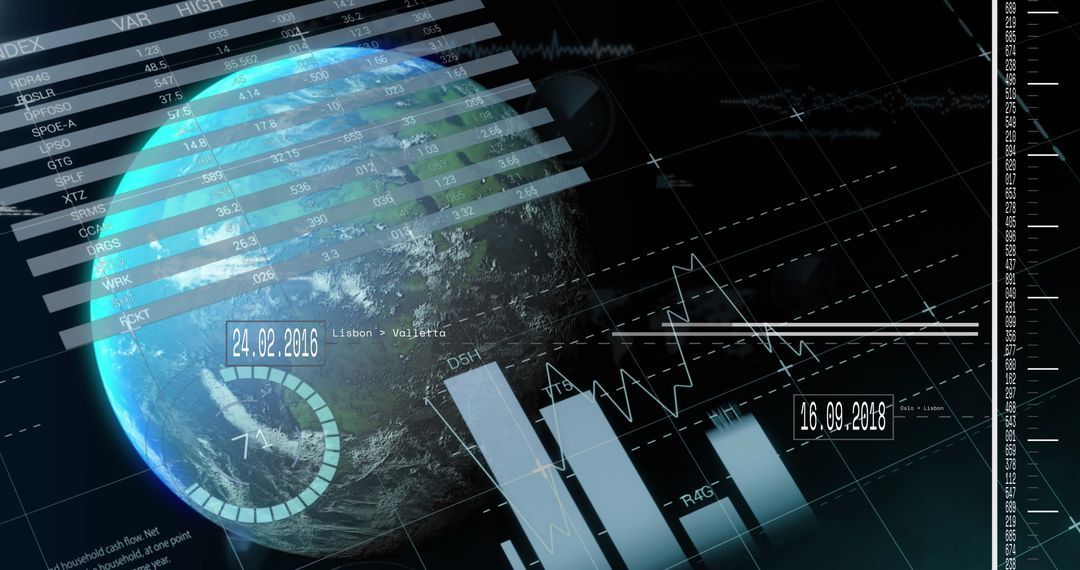
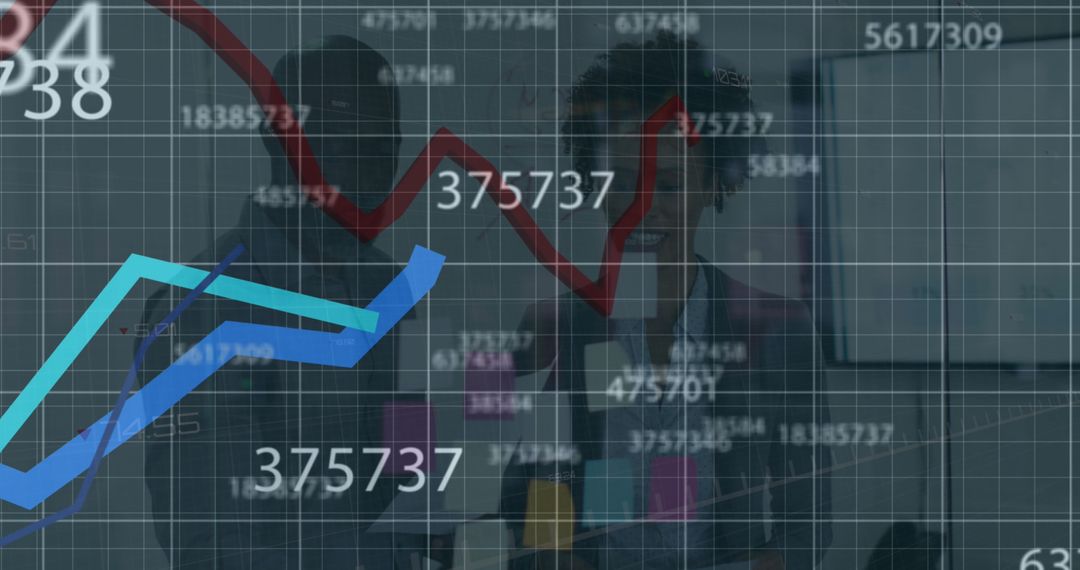
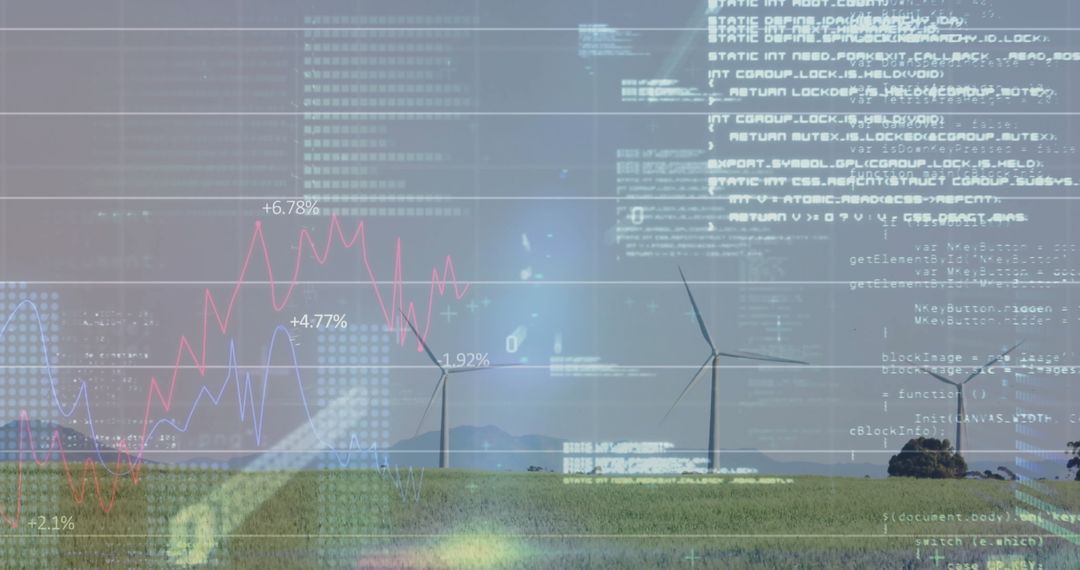
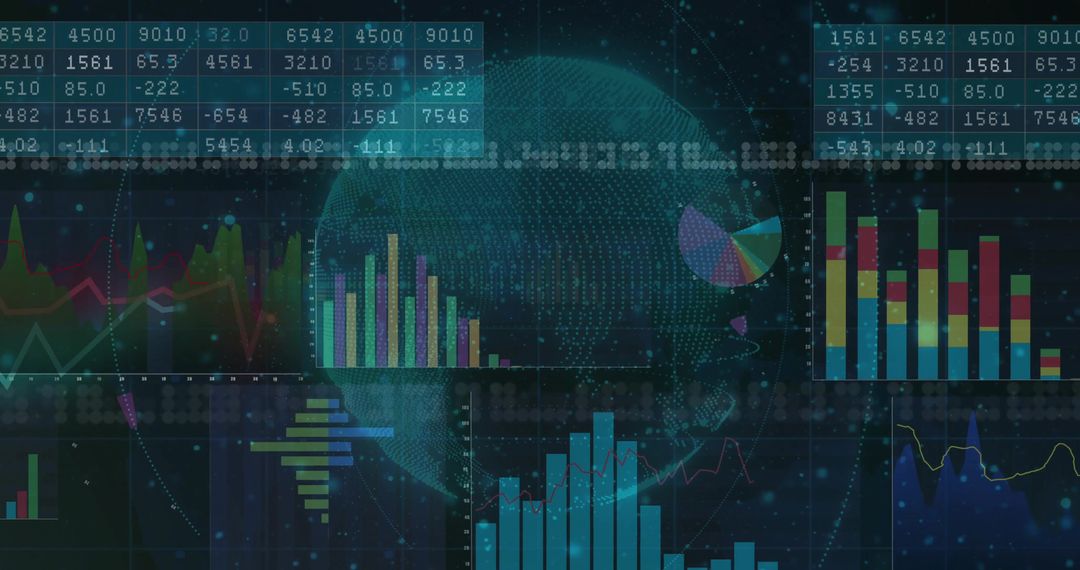
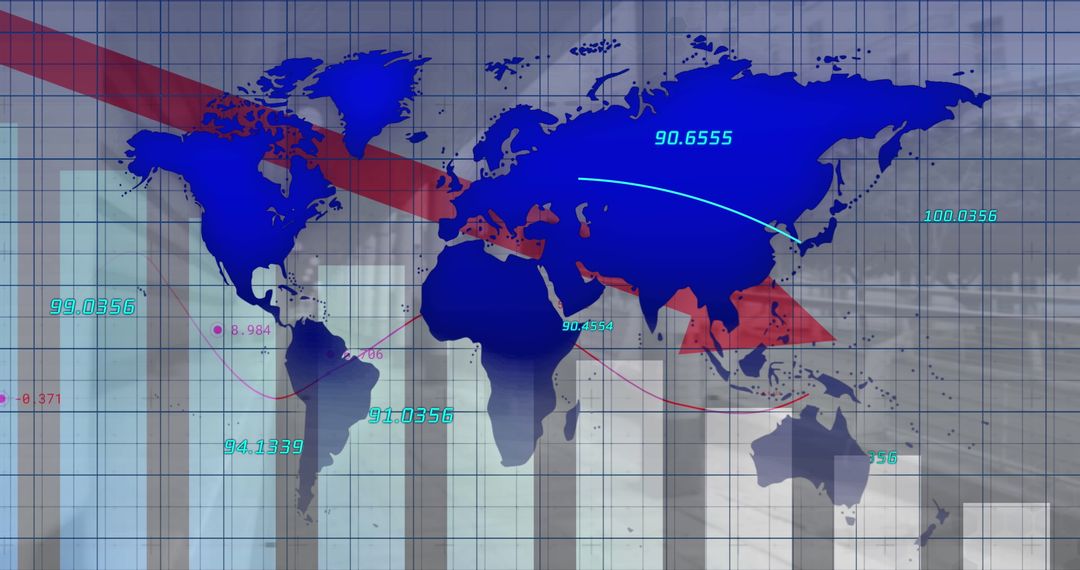
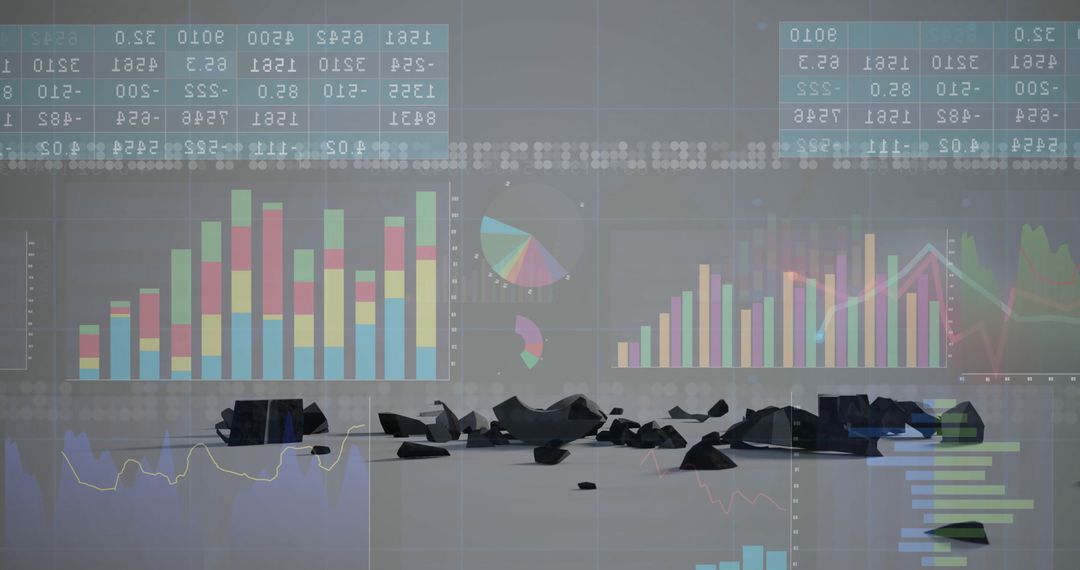
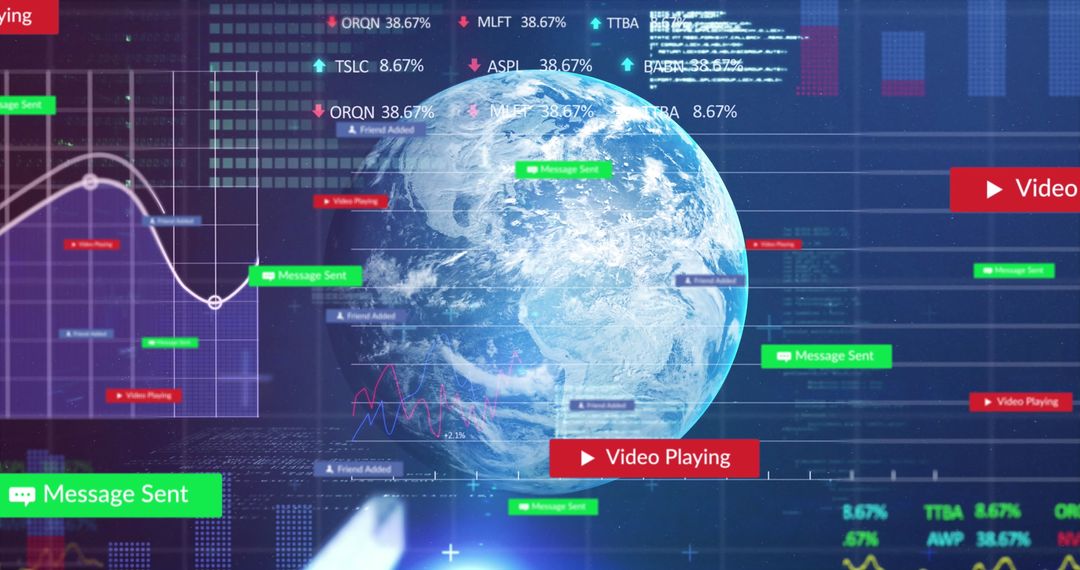
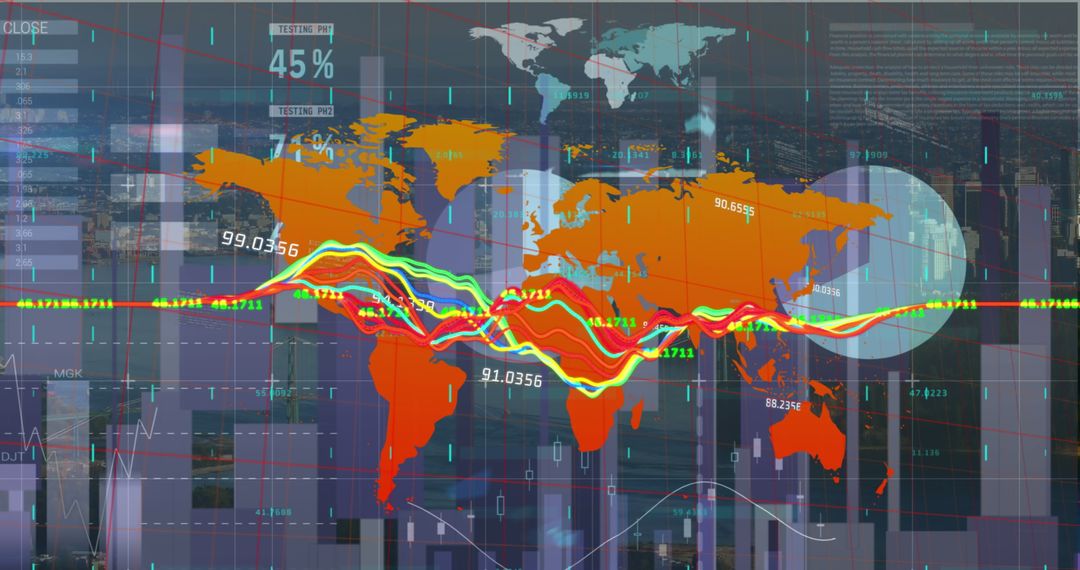
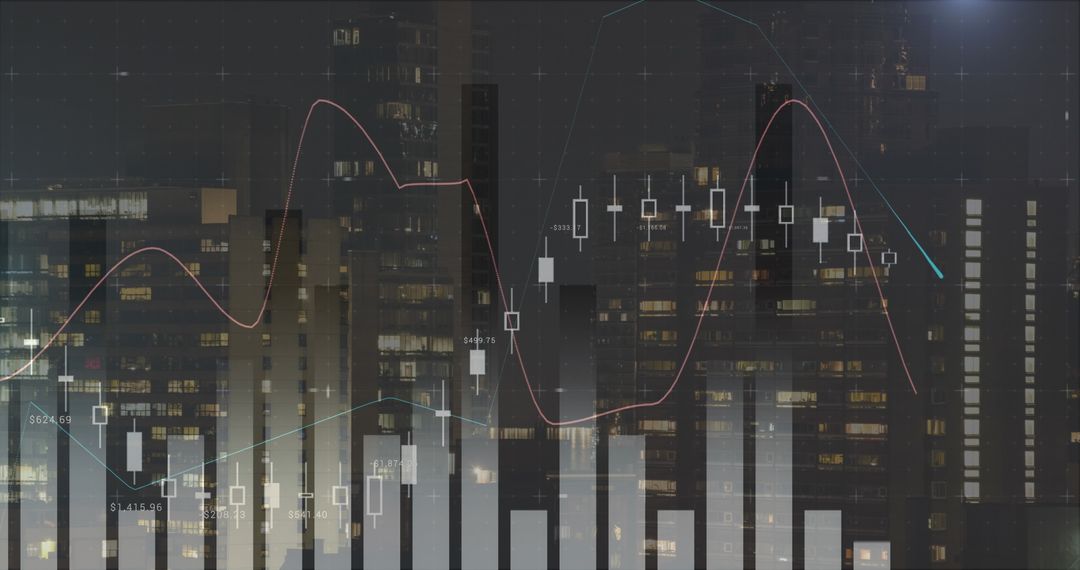
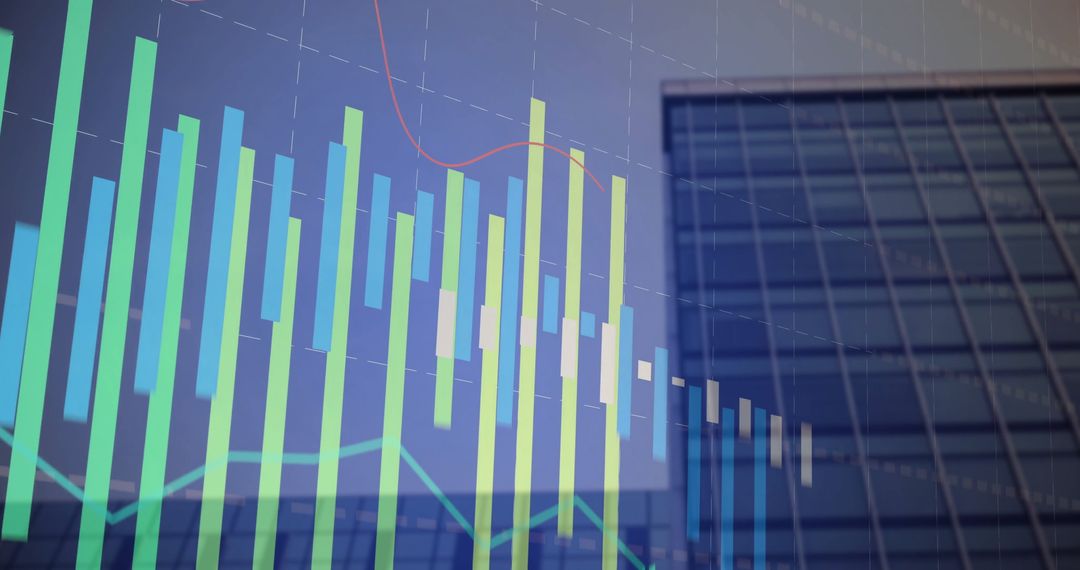
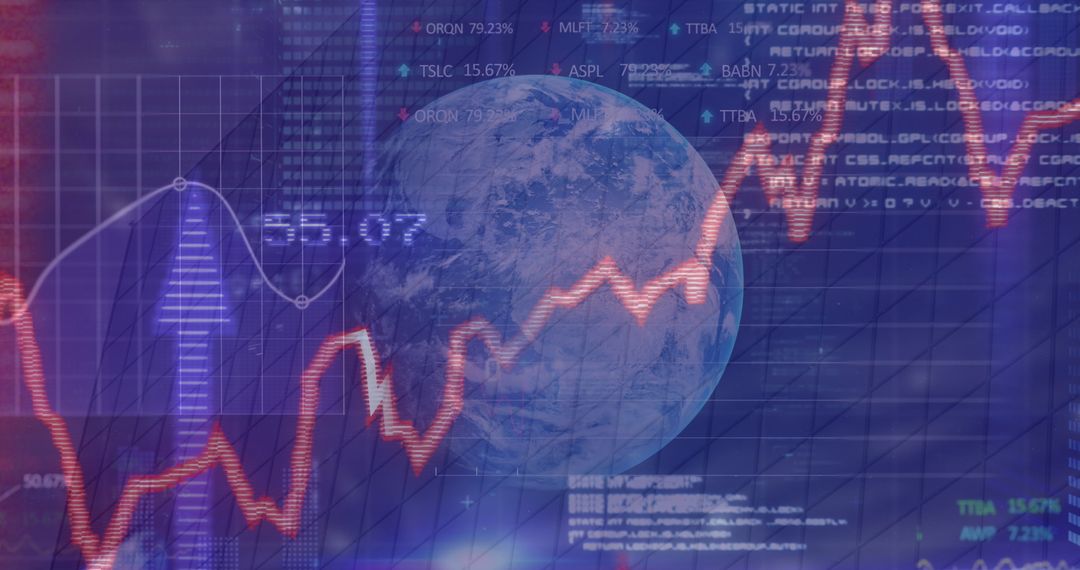
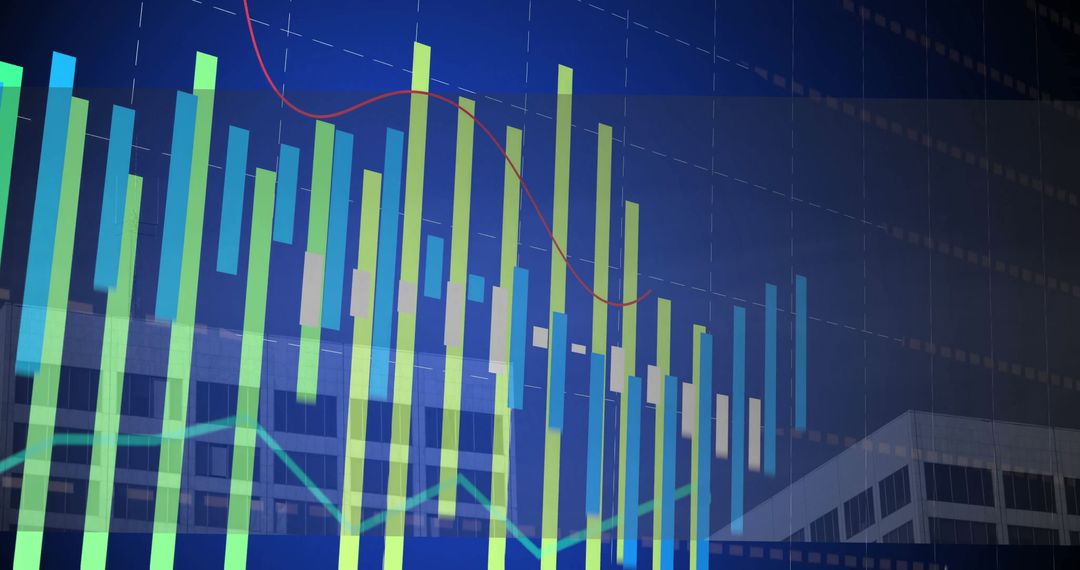
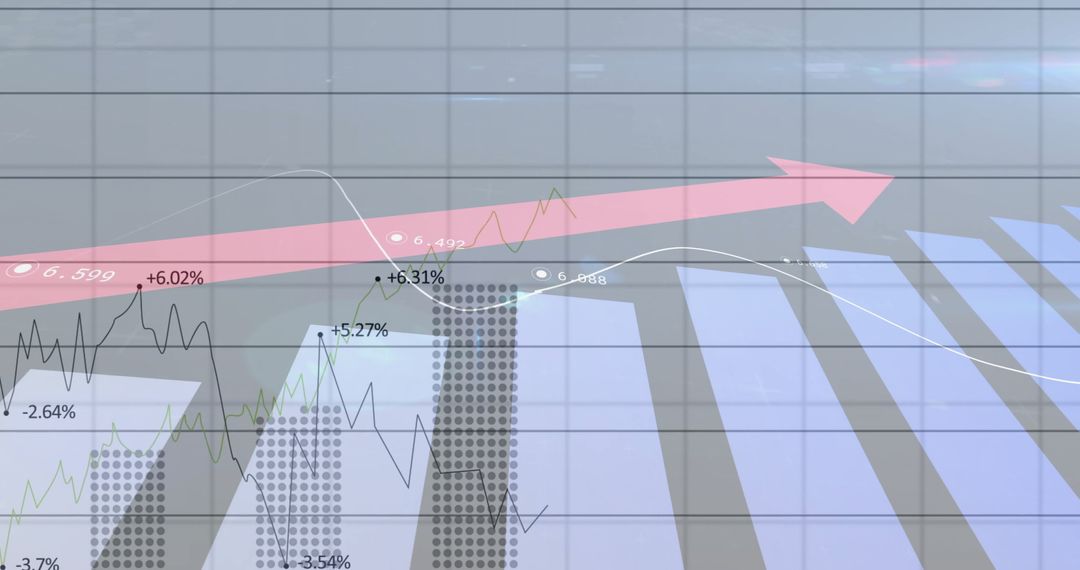
- Global Financial Data and Trends with Digital Earth Background
Global Financial Data and Trends with Digital Earth Background Image

Illustrates global financial trends with prominent graphs and digital earth image, emphasizing the interconnected nature of modern economy. Useful for articles or websites focusing on international finance, technological impacts on markets, or economic analysis tools.
Powered by  - Get 15% off with code: PIKWIZARD15


2
downloads
downloads
Tags:
More
Credit Photo
If you would like to credit the Photo, here are some ways you can do so
Text Link
photo Link
<span class="text-link">
<span>
<a target="_blank" href=https://pikwizard.com/photo/global-financial-data-and-trends-with-digital-earth-background/0142dd1c1ea33e9bfa7fa75a08588ef9/>PikWizard</a>
</span>
</span>
<span class="image-link">
<span
style="margin: 0 0 20px 0; display: inline-block; vertical-align: middle; width: 100%;"
>
<a
target="_blank"
href="https://pikwizard.com/photo/global-financial-data-and-trends-with-digital-earth-background/0142dd1c1ea33e9bfa7fa75a08588ef9/"
style="text-decoration: none; font-size: 10px; margin: 0;"
>
<img src="https://pikwizard.com/pw/medium/0142dd1c1ea33e9bfa7fa75a08588ef9.jpg" style="margin: 0; width: 100%;" alt="" />
<p style="font-size: 12px; margin: 0;">PikWizard</p>
</a>
</span>
</span>
Free (free of charge)
Free for personal and commercial use.
Author: People Creations
Similar Free Stock Images

Premium


Premium


Premium


Premium


Premium


Premium


Premium


Premium


Premium


Premium


Premium


Premium


Premium

Premium


Premium


Premium


Premium


Premium


Premium

Premium


Premium


Premium


Premium


Premium