
- Home >
- Stock Photos >
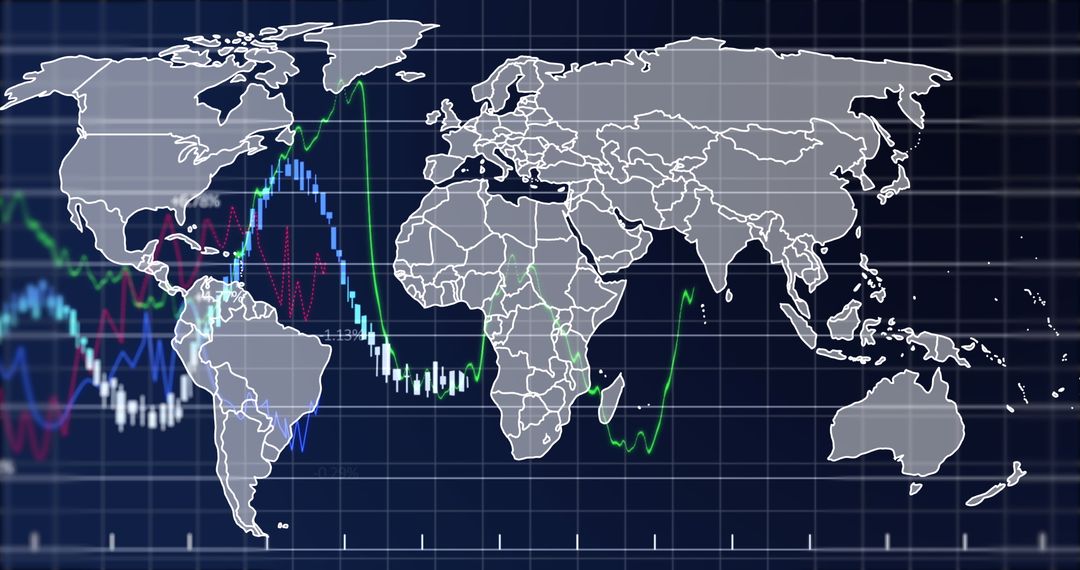
- Global Financial Data with World Map and Statistics
Global Financial Data with World Map and Statistics Image

Conceptual illustration showing graphs overlying a digital world map, perfect for presentations on global finance, economic trends, or data analysis topics. Ideal for use in business reports, financial forecasts, and digital dashboards to enhance the visual impact when discussing market performance and economic statistics globally.
Powered by  - Get 15% off with code: PIKWIZARD15


2
downloads
downloads
Tags:
More
Credit Photo
If you would like to credit the Photo, here are some ways you can do so
Text Link
photo Link
<span class="text-link">
<span>
<a target="_blank" href=https://pikwizard.com/photo/global-financial-data-with-world-map-and-statistics/ef78bd7301cc7d33a1d505492d63e3f4/>PikWizard</a>
</span>
</span>
<span class="image-link">
<span
style="margin: 0 0 20px 0; display: inline-block; vertical-align: middle; width: 100%;"
>
<a
target="_blank"
href="https://pikwizard.com/photo/global-financial-data-with-world-map-and-statistics/ef78bd7301cc7d33a1d505492d63e3f4/"
style="text-decoration: none; font-size: 10px; margin: 0;"
>
<img src="https://pikwizard.com/pw/medium/ef78bd7301cc7d33a1d505492d63e3f4.jpg" style="margin: 0; width: 100%;" alt="" />
<p style="font-size: 12px; margin: 0;">PikWizard</p>
</a>
</span>
</span>
Free (free of charge)
Free for personal and commercial use.
Author: Authentic Images
Similar Free Stock Images

Premium


Premium


Premium


Premium


Premium


Premium


Premium


Premium


Premium


Premium


Premium


Premium


Premium


Premium


Premium


Premium


Premium


Premium


Premium


Premium


Premium


Premium


Premium


Premium


Premium

