- Home >
- Stock Photos >
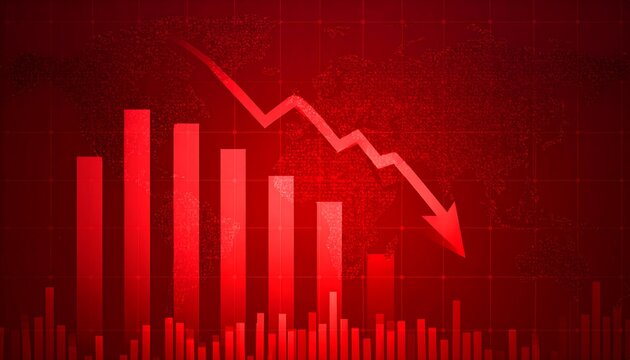
- Global Financial Decline Indicator with Analytic Graphs
Global Financial Decline Indicator with Analytic Graphs Image

Red descending line on grid symbolizing financial market decline with various analytic graphs like candlestick charts and column bars in background, illustrating global economic trends and investment risks. Useful for finance books, investment strategy materials, economic presentations or articles about market trends; conveys risk, volatility, or economic change.
Powered by 


0
downloads
downloads
Tags:
More
Credit Photo
If you would like to credit the Photo, here are some ways you can do so
Text Link
photo Link
<span class="text-link">
<span>
<a target="_blank" href=https://pikwizard.com/photo/global-financial-decline-indicator-with-analytic-graphs/70374b8216bef83b7b20c14f4a73e1c9/>PikWizard</a>
</span>
</span>
<span class="image-link">
<span
style="margin: 0 0 20px 0; display: inline-block; vertical-align: middle; width: 100%;"
>
<a
target="_blank"
href="https://pikwizard.com/photo/global-financial-decline-indicator-with-analytic-graphs/70374b8216bef83b7b20c14f4a73e1c9/"
style="text-decoration: none; font-size: 10px; margin: 0;"
>
<img src="https://pikwizard.com/pw/medium/70374b8216bef83b7b20c14f4a73e1c9.jpg" style="margin: 0; width: 100%;" alt="" />
<p style="font-size: 12px; margin: 0;">PikWizard</p>
</a>
</span>
</span>
Free (free of charge)
Free for personal and commercial use.
Author: People Creations
Similar Free Stock Images

Premium


Premium


Premium


Premium


Premium


Premium


Premium


Premium


Premium


Premium


Premium


Premium


Premium


Premium


Premium


Premium


Premium


Premium


Premium


Premium


Premium


Premium


Premium


Premium