- Home >
- Stock Photos >
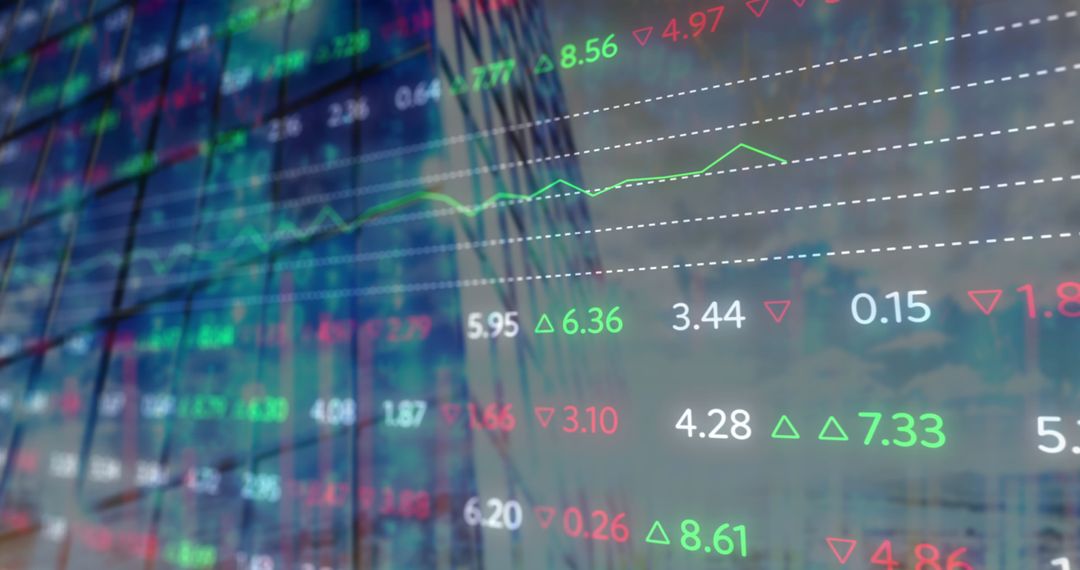
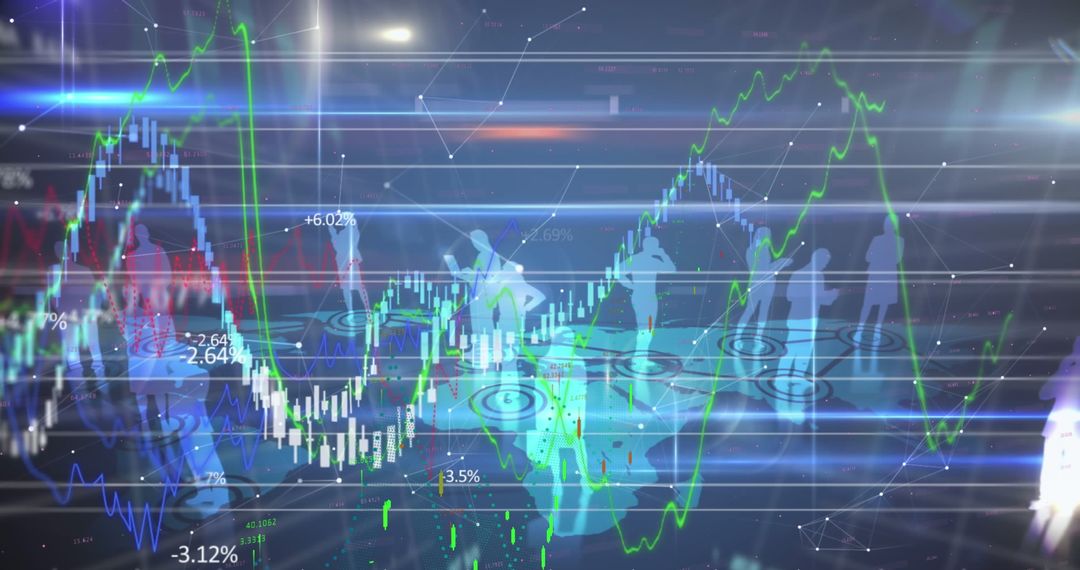
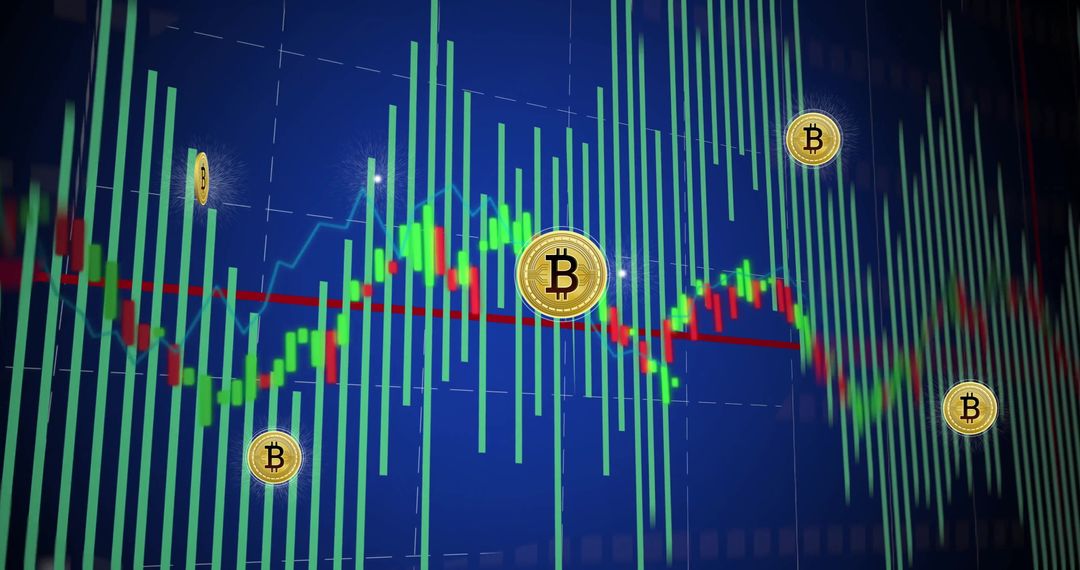
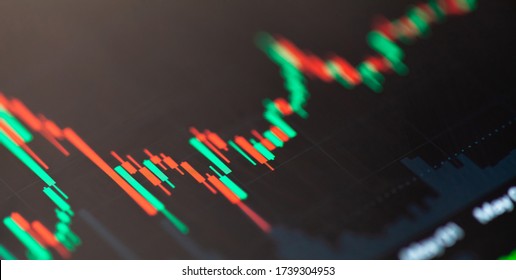
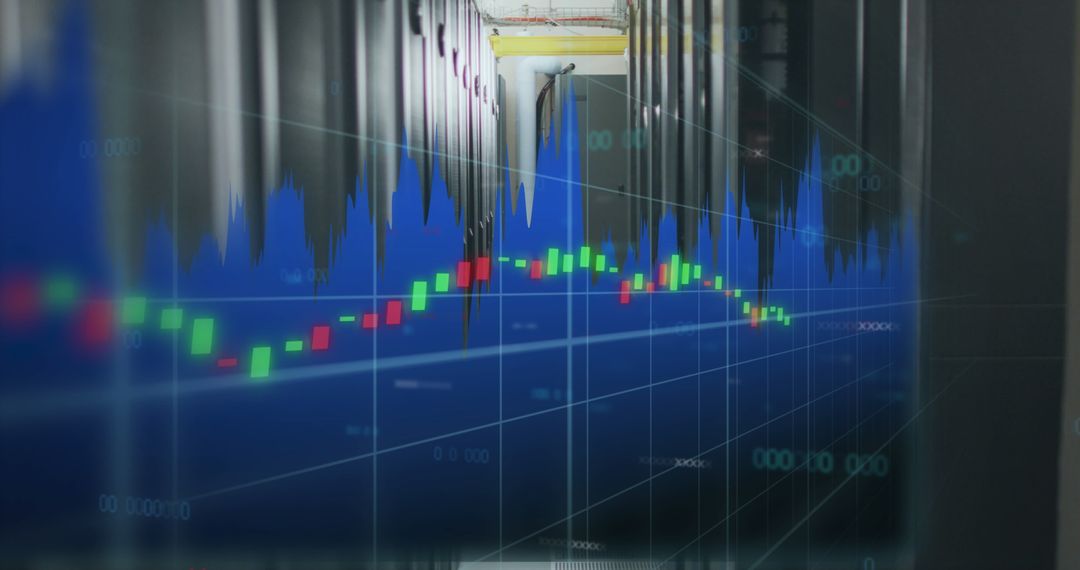
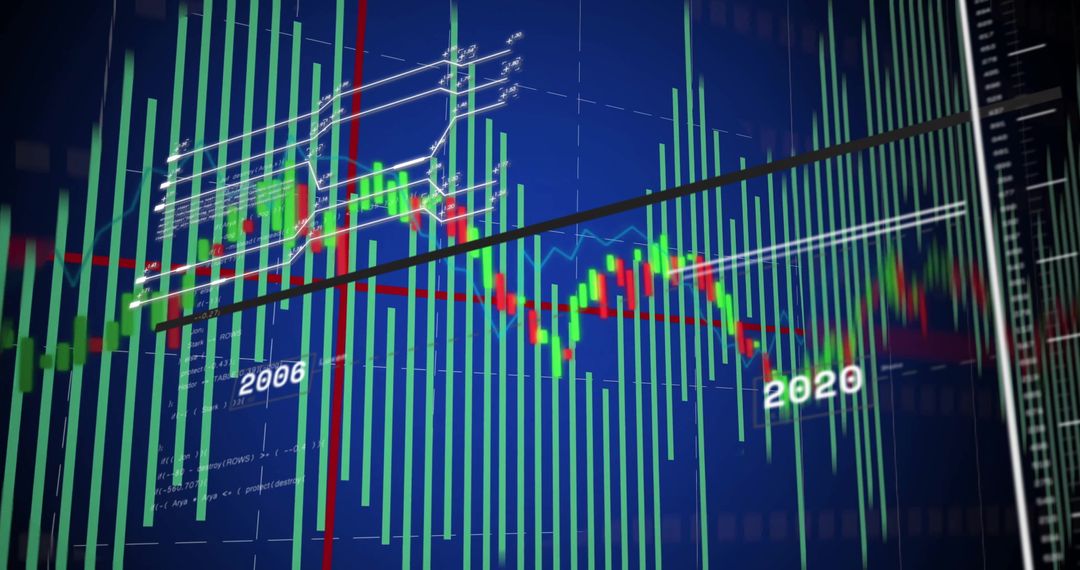
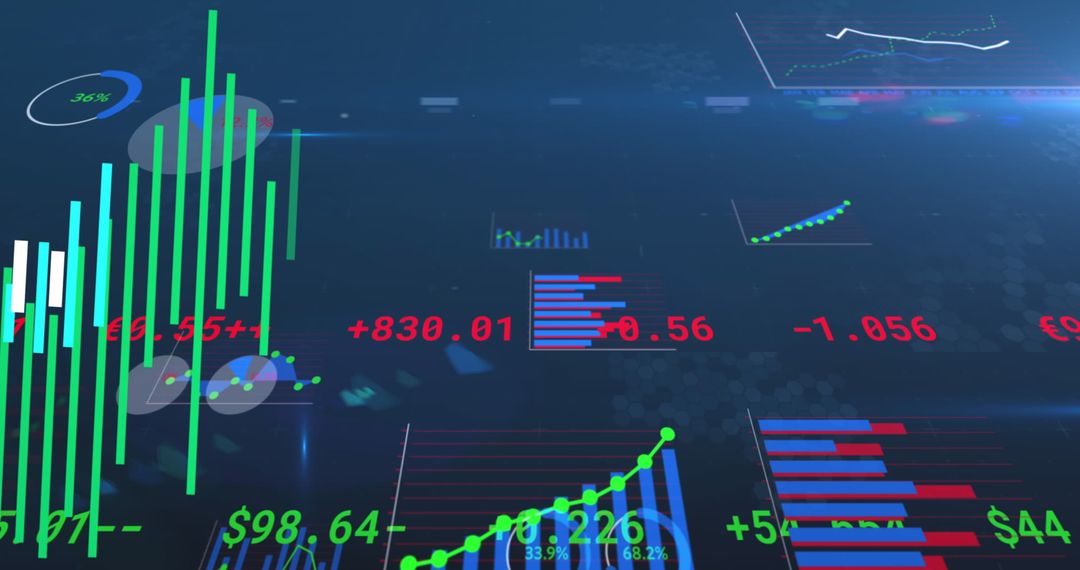
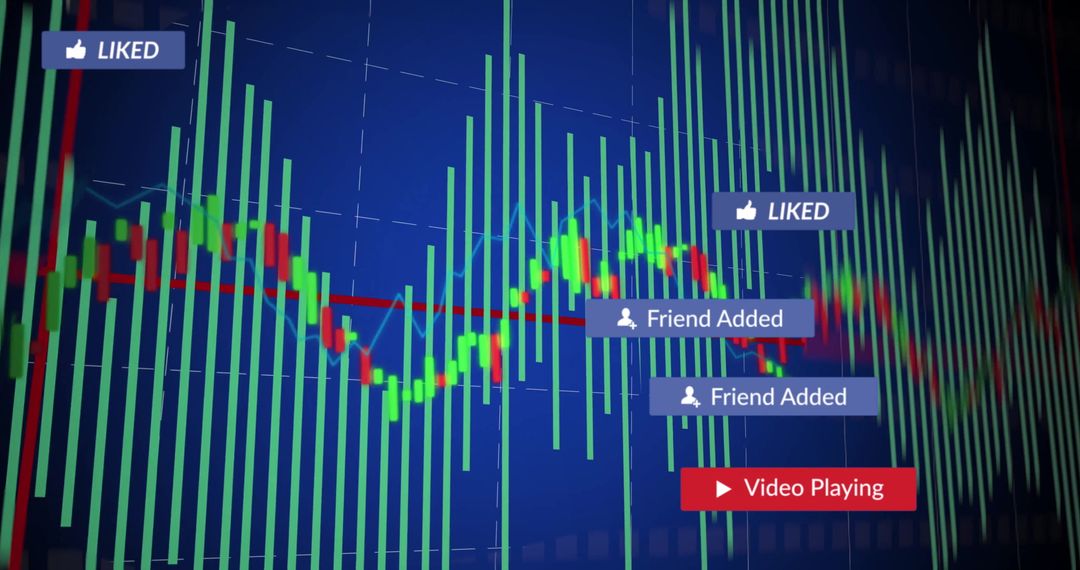
- Global Financial Market Analysis with Candlestick Charts
Global Financial Market Analysis with Candlestick Charts Image
Represents impact of global events on financial markets. Useful for content related to investment strategies, economic analysis reports, and presentations on market trends and data visualization. Ideal as a backdrop in industry articles about economic growth and technological advancement.
Powered by  - Get 15% off with code: PIKWIZARD15


0
downloads
downloads
Tags:
More
Credit Photo
If you would like to credit the Photo, here are some ways you can do so
Text Link
photo Link
<span class="text-link">
<span>
<a target="_blank" href=https://pikwizard.com/photo/global-financial-market-analysis-with-candlestick-charts/e01dffe70a9d703a00721c13bb2a5384/>PikWizard</a>
</span>
</span>
<span class="image-link">
<span
style="margin: 0 0 20px 0; display: inline-block; vertical-align: middle; width: 100%;"
>
<a
target="_blank"
href="https://pikwizard.com/photo/global-financial-market-analysis-with-candlestick-charts/e01dffe70a9d703a00721c13bb2a5384/"
style="text-decoration: none; font-size: 10px; margin: 0;"
>
<img src="https://pikwizard.com/pw/medium/e01dffe70a9d703a00721c13bb2a5384.jpg" style="margin: 0; width: 100%;" alt="" />
<p style="font-size: 12px; margin: 0;">PikWizard</p>
</a>
</span>
</span>
Free (free of charge)
Free for personal and commercial use.
Author: Awesome Content
Similar Free Stock Images
Premium


Premium


Premium


Premium


Premium


Premium


Premium


Premium


Premium


Premium


Premium


Premium


Premium


Premium


Premium


Premium


Premium


Premium


Premium


Premium


Premium


Premium

Premium


Premium