- Home >
- Stock Photos >
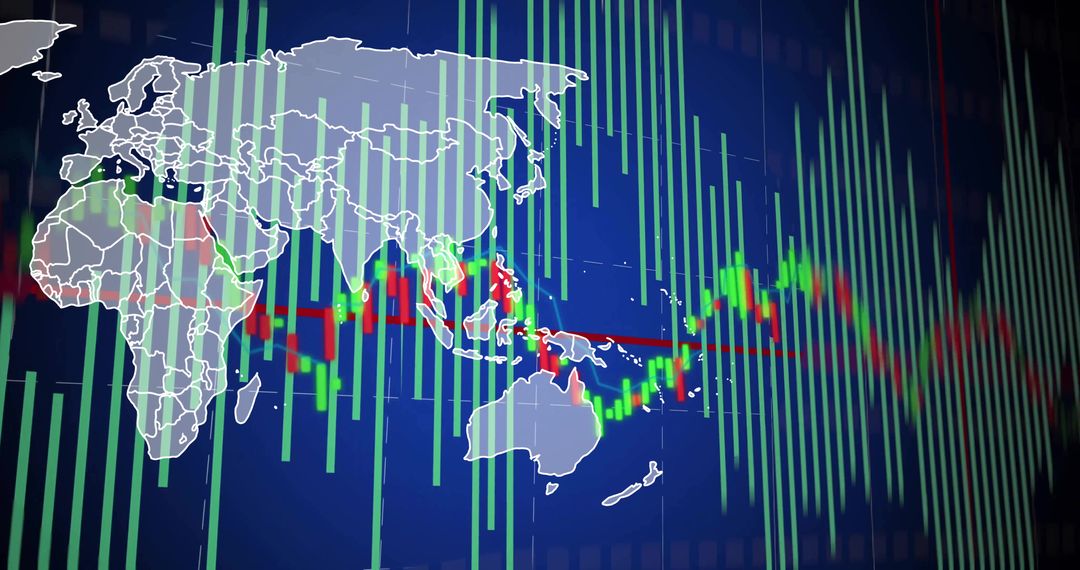
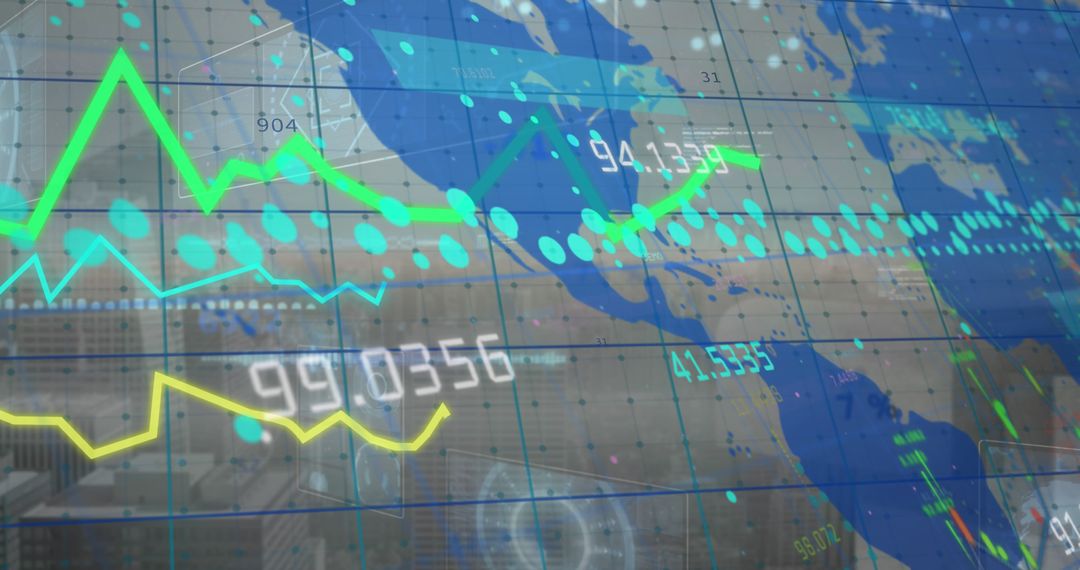
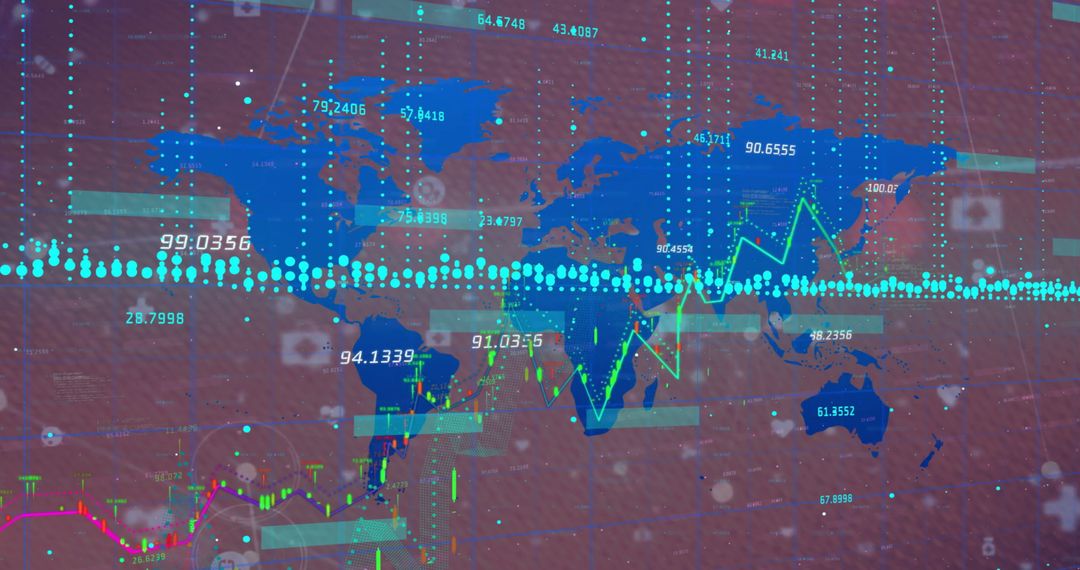
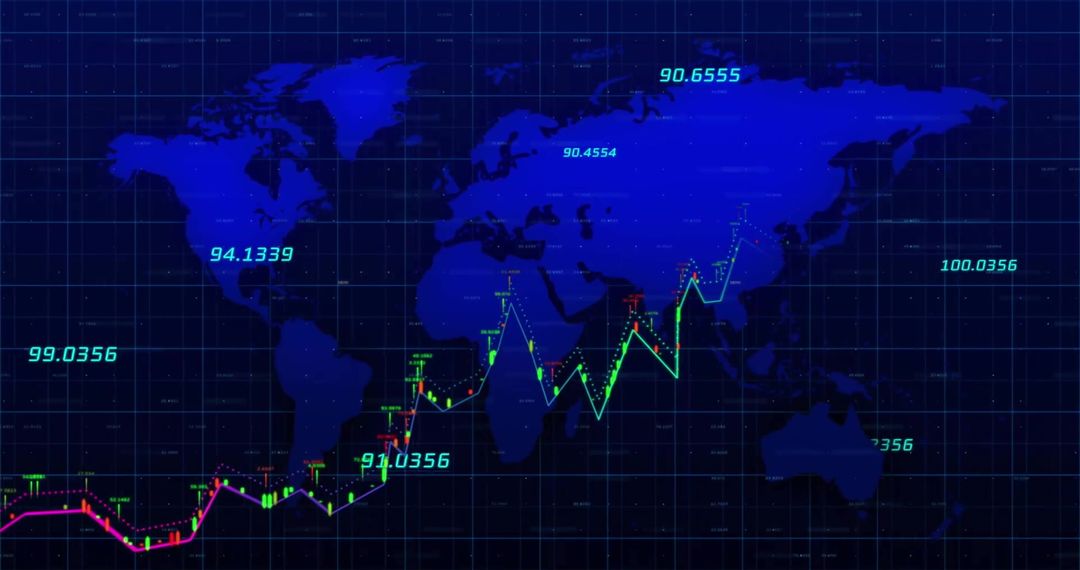
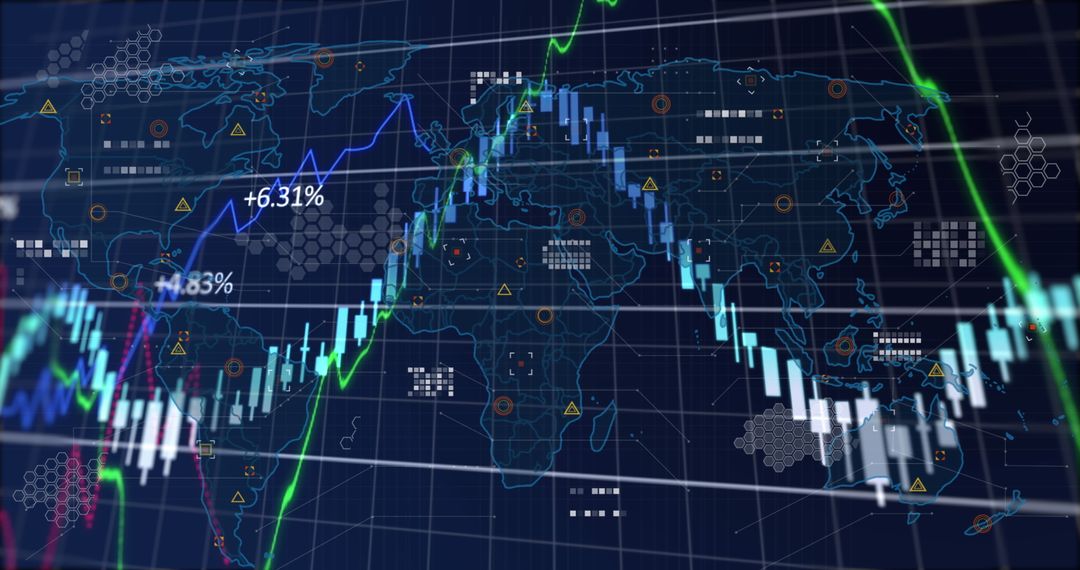
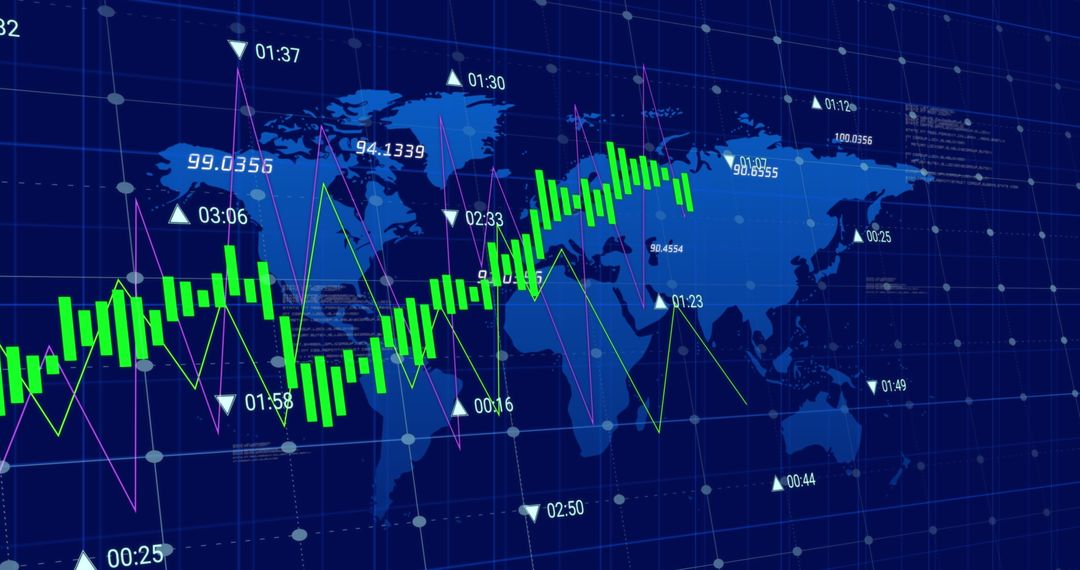
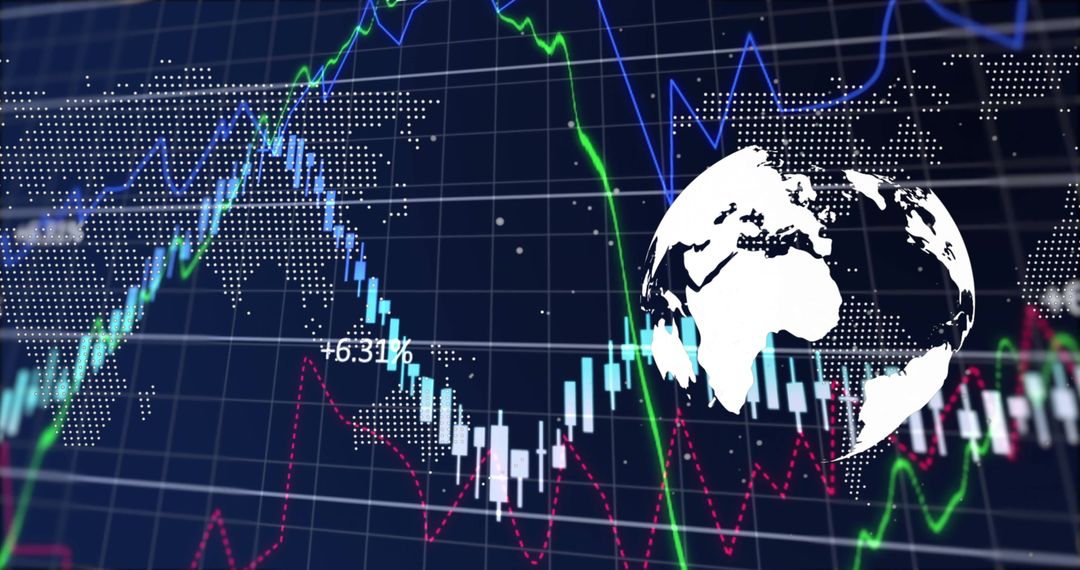
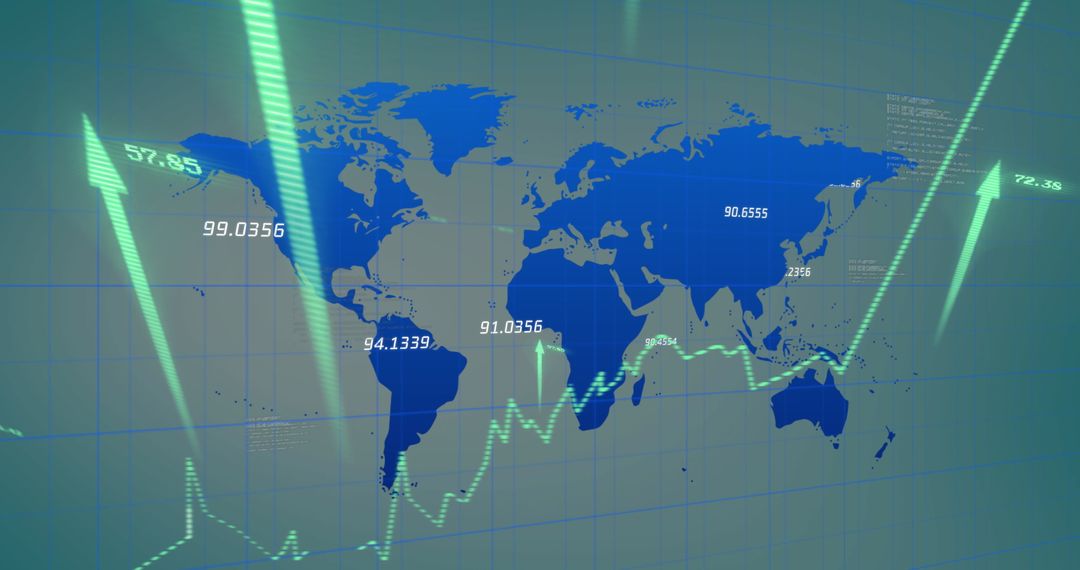
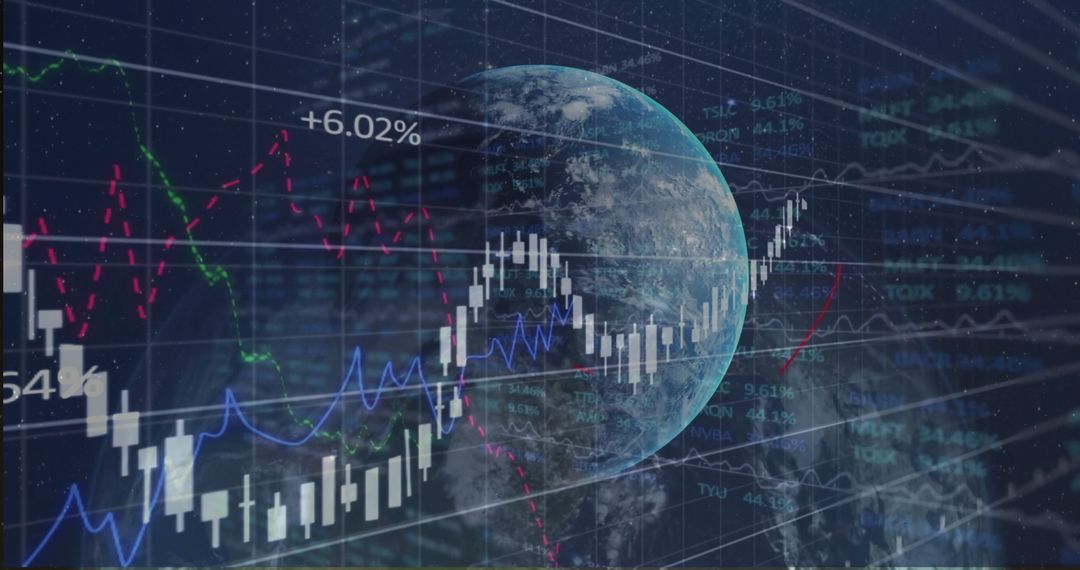
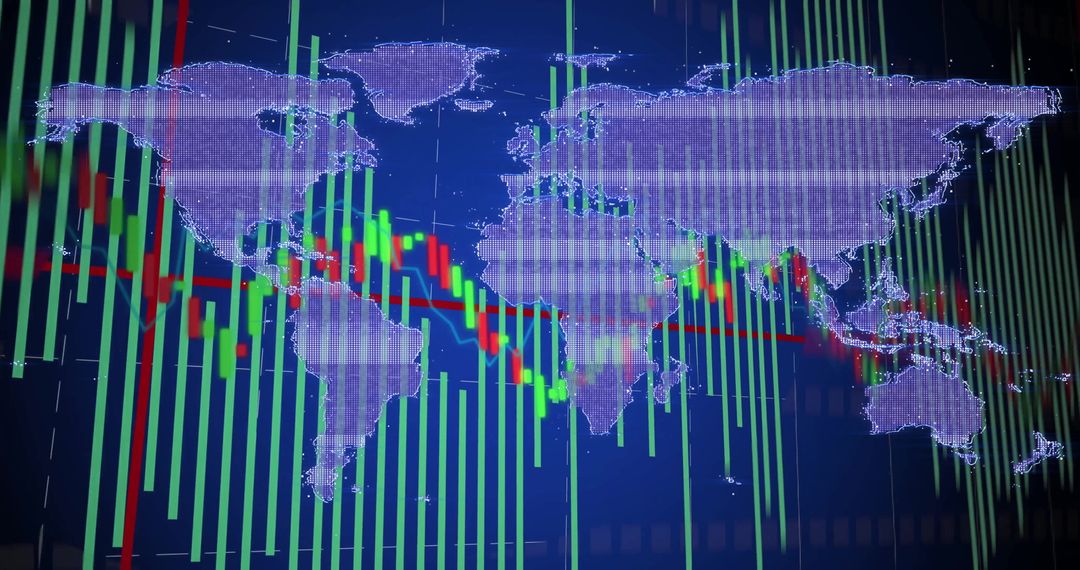
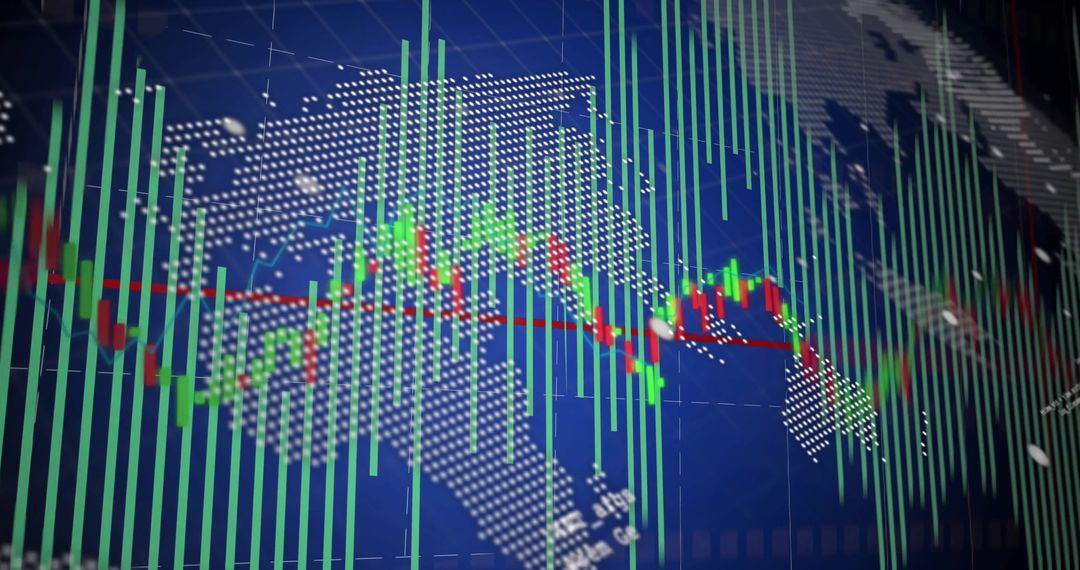
- Global Financial Market Candlestick Chart Overlay with World Map
Global Financial Market Candlestick Chart Overlay with World Map Image
Global financial interface with candlestick charts overlayed on world map underlines concepts of international economic trends and trading. Useful for illustrations for financial analytics, global trading strategies, fintech development, or presentations in economics and finance atmospheres. Can portray insights in various financial apps or reports taking emphasis on cross-border market activities.
Powered by 


0
downloads
downloads
Tags:
More
Credit Photo
If you would like to credit the Photo, here are some ways you can do so
Text Link
photo Link
<span class="text-link">
<span>
<a target="_blank" href=https://pikwizard.com/photo/global-financial-market-candlestick-chart-overlay-with-world-map/b7f0050c3a7c3ad7dcd73fb0bbdeb4a4/>PikWizard</a>
</span>
</span>
<span class="image-link">
<span
style="margin: 0 0 20px 0; display: inline-block; vertical-align: middle; width: 100%;"
>
<a
target="_blank"
href="https://pikwizard.com/photo/global-financial-market-candlestick-chart-overlay-with-world-map/b7f0050c3a7c3ad7dcd73fb0bbdeb4a4/"
style="text-decoration: none; font-size: 10px; margin: 0;"
>
<img src="https://pikwizard.com/pw/medium/b7f0050c3a7c3ad7dcd73fb0bbdeb4a4.jpg" style="margin: 0; width: 100%;" alt="" />
<p style="font-size: 12px; margin: 0;">PikWizard</p>
</a>
</span>
</span>
Free (free of charge)
Free for personal and commercial use.
Author: Creative Art
Similar Free Stock Images

Premium


Premium


Premium


Premium


Premium


Premium


Premium


Premium


Premium


Premium


Premium


Premium


Premium


Premium


Premium


Premium


Premium


Premium


Premium


Premium


Premium


Premium


Premium


Premium