
- Home >
- Stock Photos >
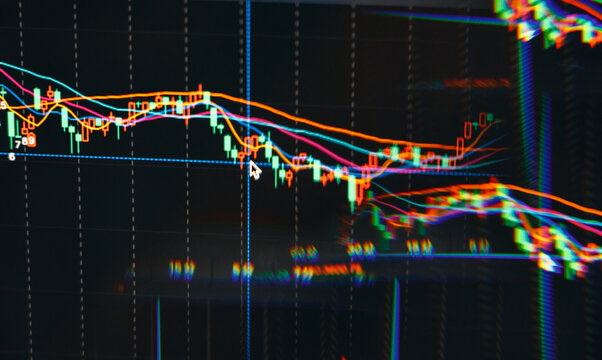
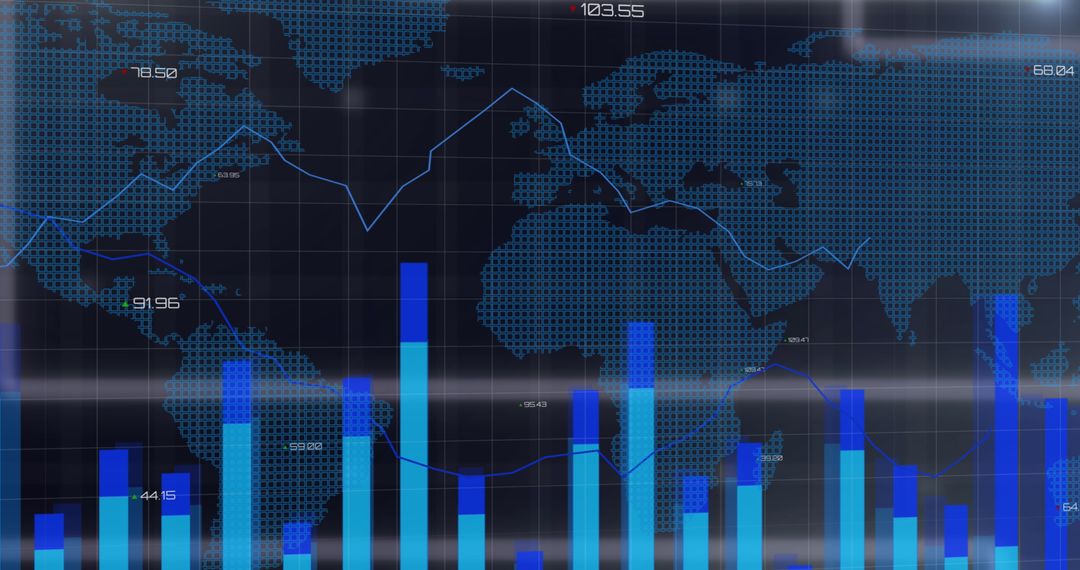
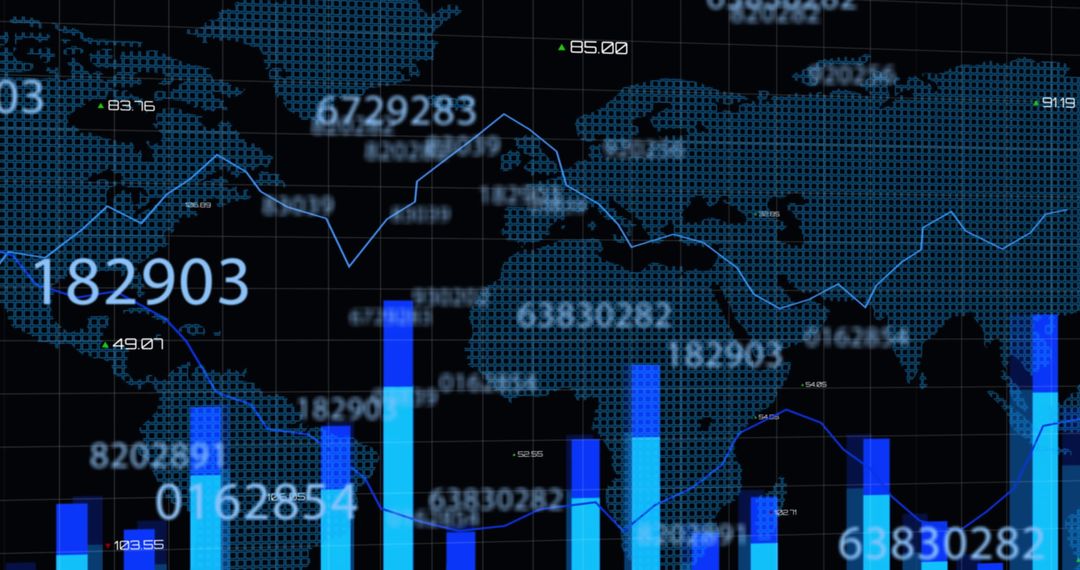
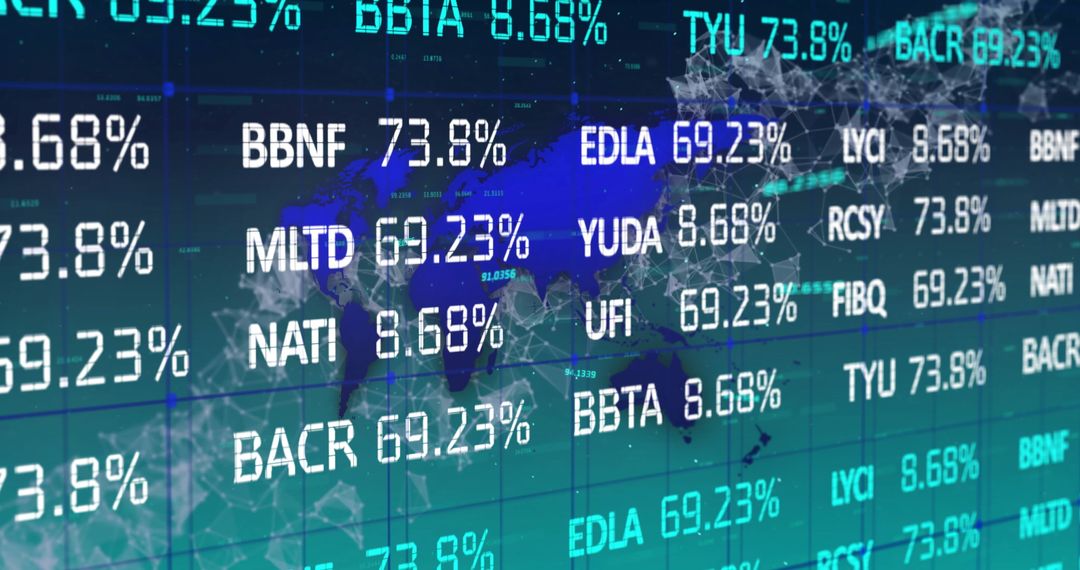
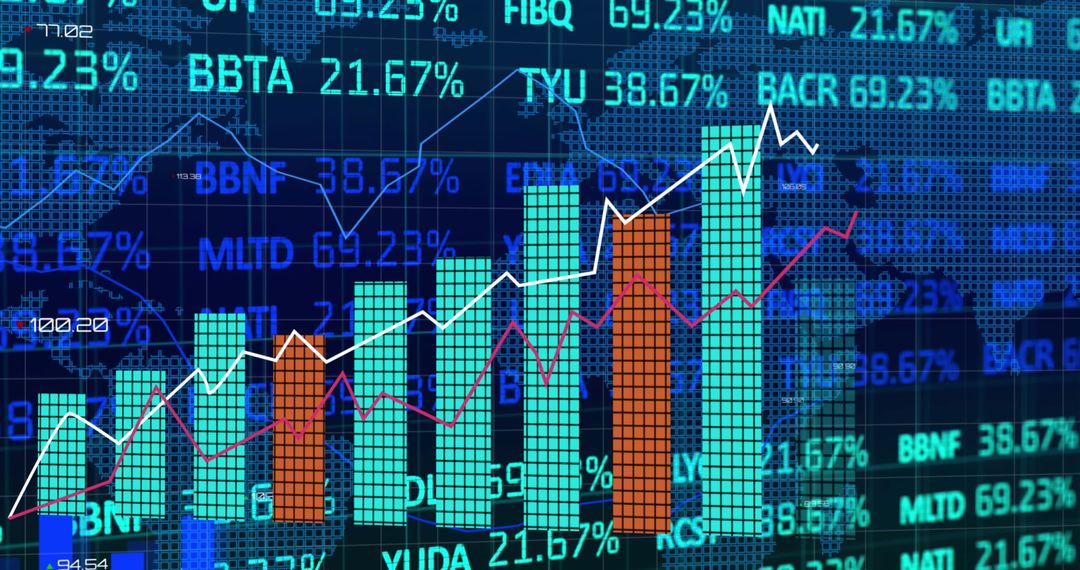
- Global Financial Market Charts with Statistics and Indicators
Global Financial Market Charts with Statistics and Indicators Image

Depicting a vibrant display of financial market activity with charts and statistics overlaying a global map. The dynamic visualization suggests ideas of investment strategies, stock analysis, and economic insights, useful for financial institutions, investors, and analytical reports.
Powered by 


2
downloads
downloads
Tags:
More
Credit Photo
If you would like to credit the Photo, here are some ways you can do so
Text Link
photo Link
<span class="text-link">
<span>
<a target="_blank" href=https://pikwizard.com/photo/global-financial-market-charts-with-statistics-and-indicators/c52f60064dad475ab4fd7a9e3b323337/>PikWizard</a>
</span>
</span>
<span class="image-link">
<span
style="margin: 0 0 20px 0; display: inline-block; vertical-align: middle; width: 100%;"
>
<a
target="_blank"
href="https://pikwizard.com/photo/global-financial-market-charts-with-statistics-and-indicators/c52f60064dad475ab4fd7a9e3b323337/"
style="text-decoration: none; font-size: 10px; margin: 0;"
>
<img src="https://pikwizard.com/pw/medium/c52f60064dad475ab4fd7a9e3b323337.jpg" style="margin: 0; width: 100%;" alt="" />
<p style="font-size: 12px; margin: 0;">PikWizard</p>
</a>
</span>
</span>
Free (free of charge)
Free for personal and commercial use.
Author: Awesome Content
Similar Free Stock Images
Premium


Premium


Premium


Premium


Premium


Premium


Premium


Premium


Premium


Premium


Premium


Premium


Premium


Premium


Premium


Premium


Premium


Premium


Premium


Premium


Premium


Premium


Premium


Premium

