- Home >
- Stock Photos >
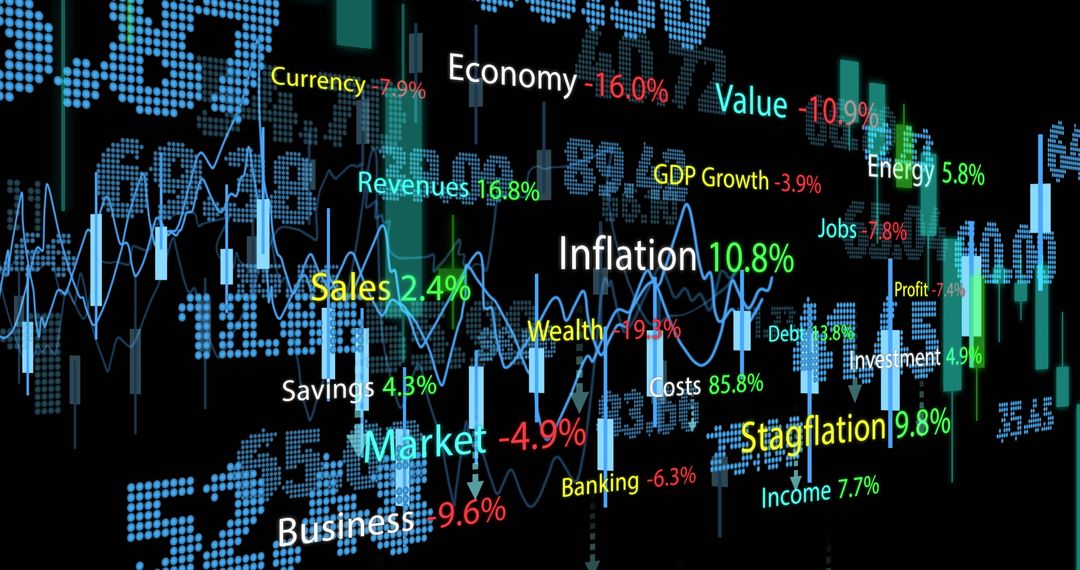
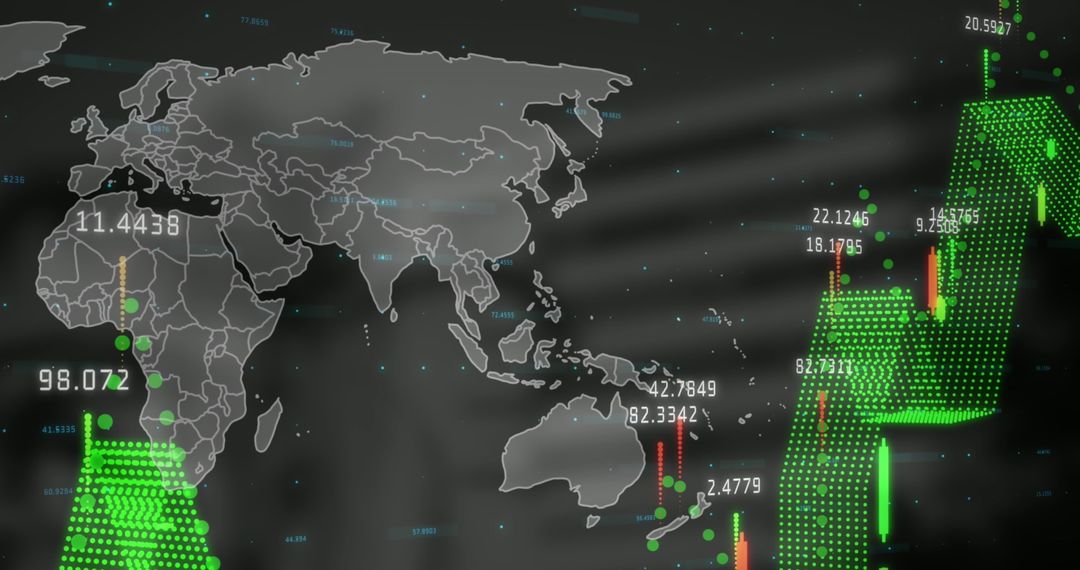
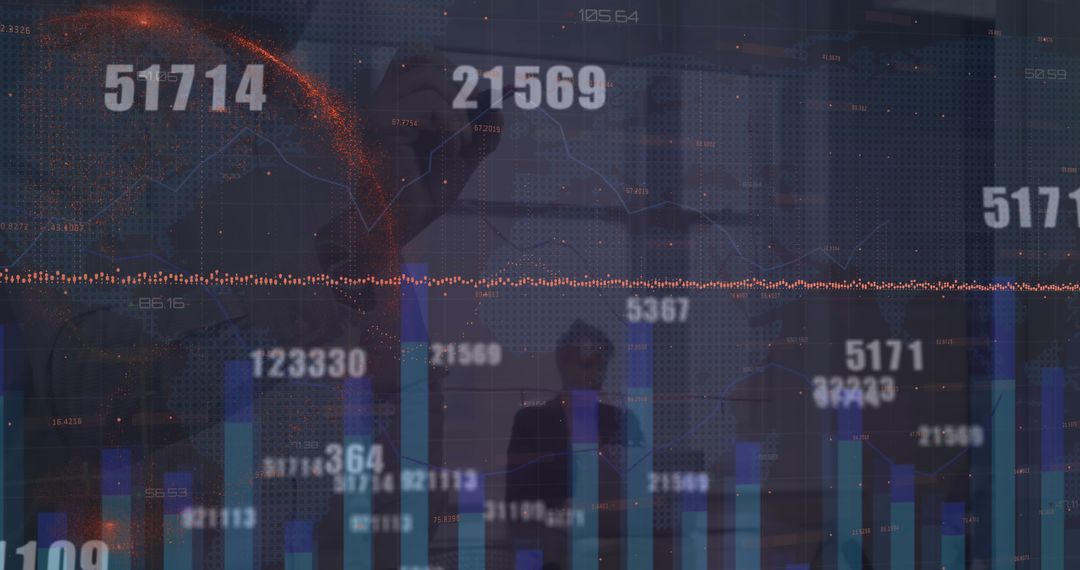
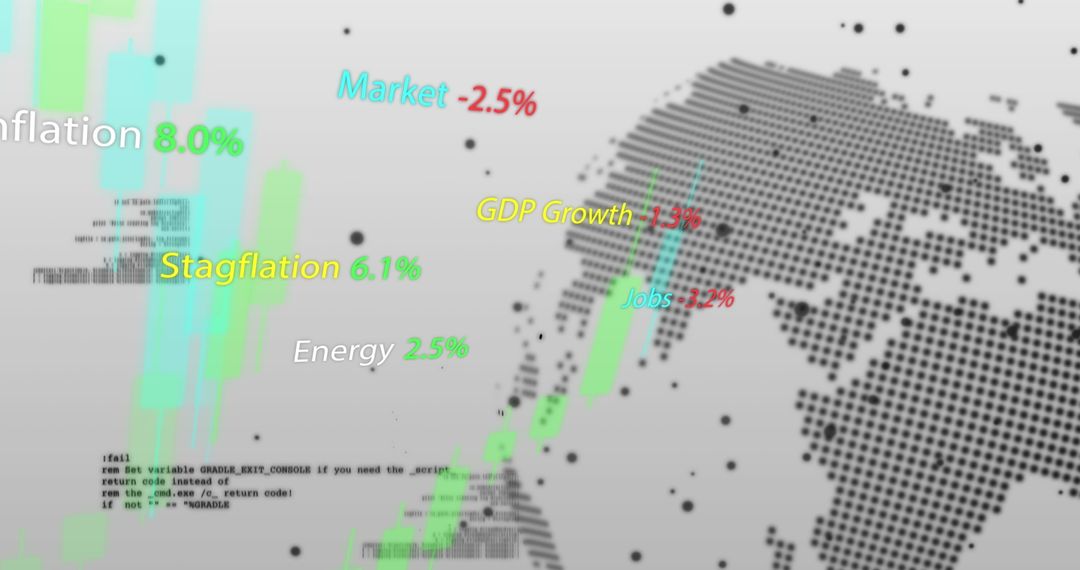
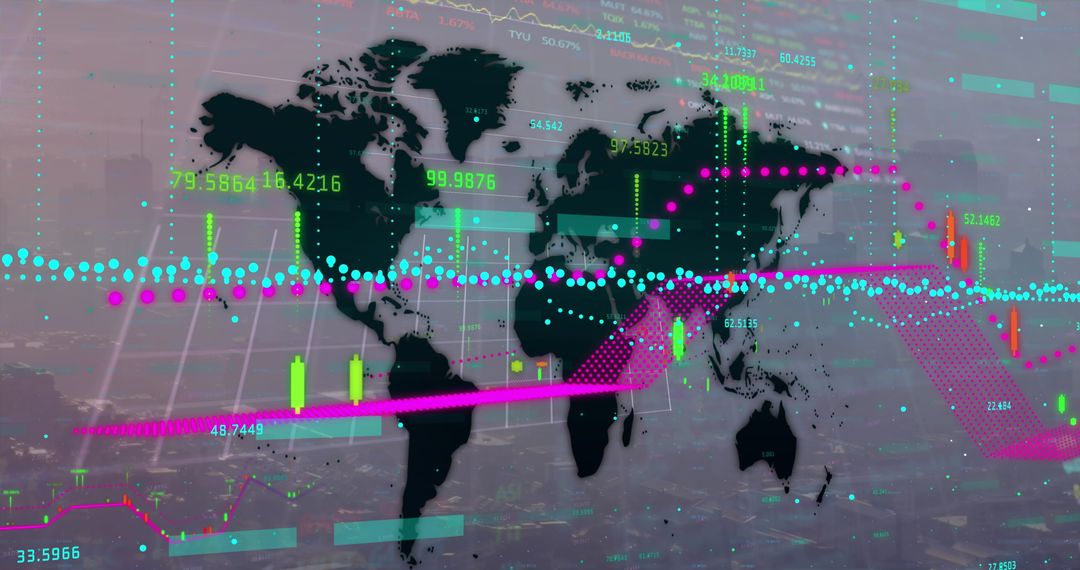
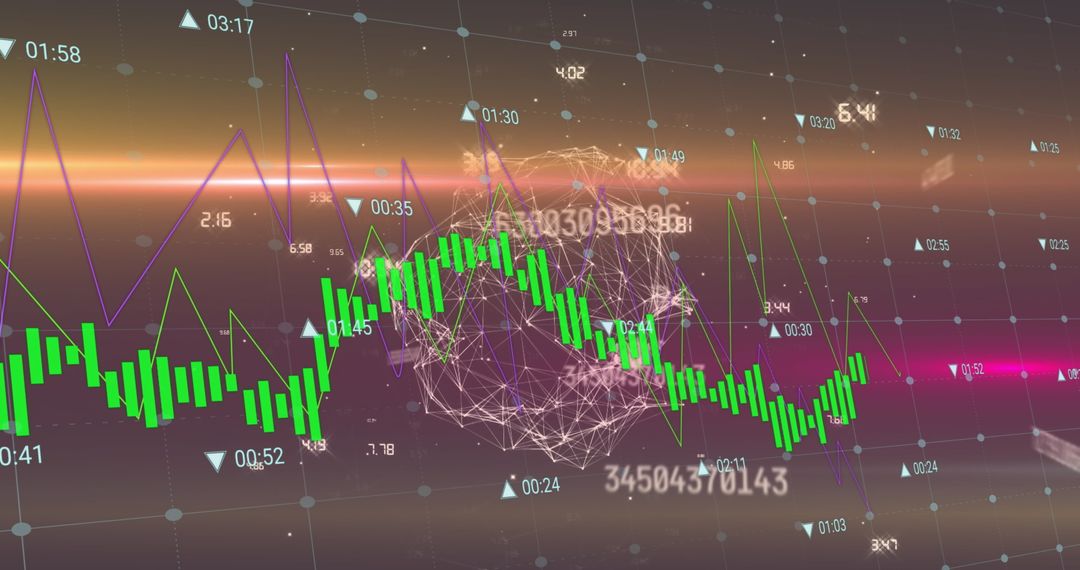
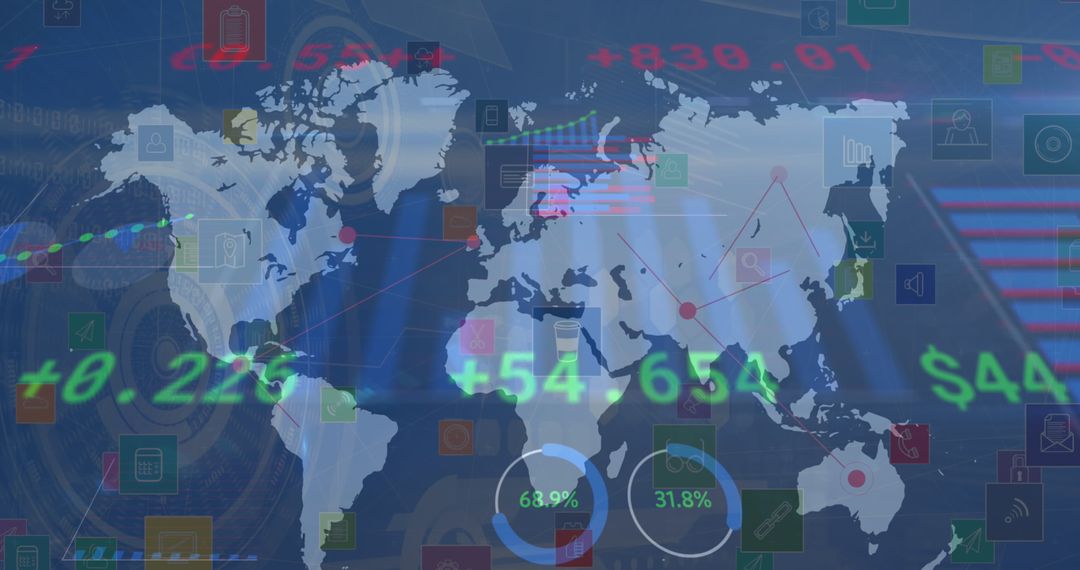
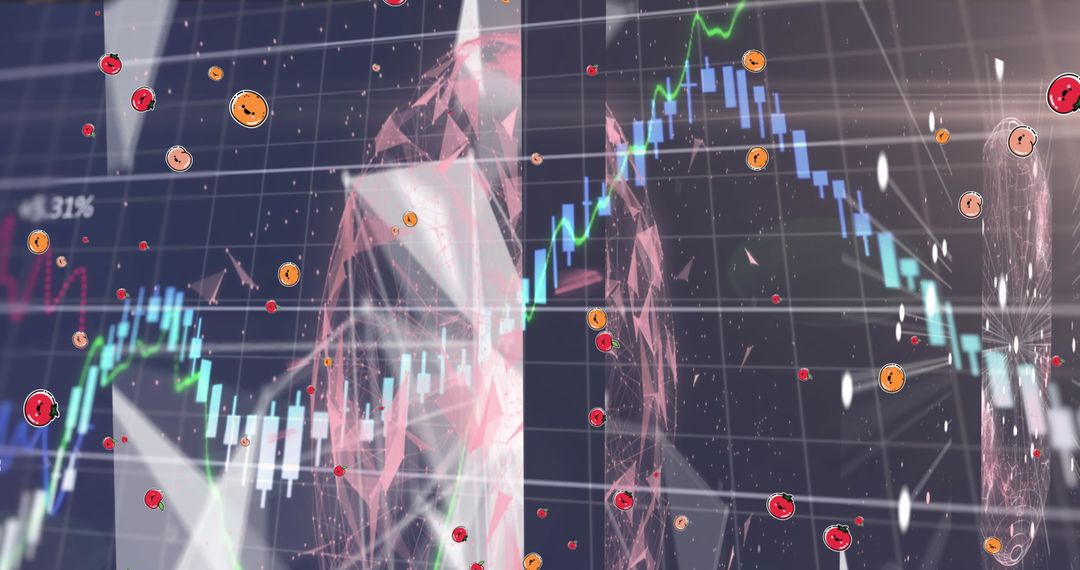
- Global Financial Metrics on Digital Dashboard with Charts and Visual Data
Global Financial Metrics on Digital Dashboard with Charts and Visual Data Image
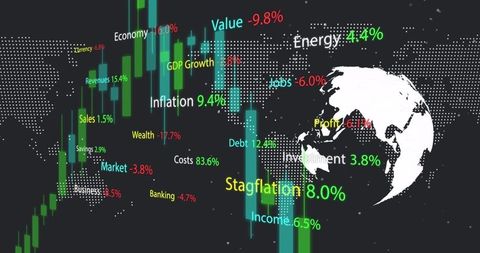
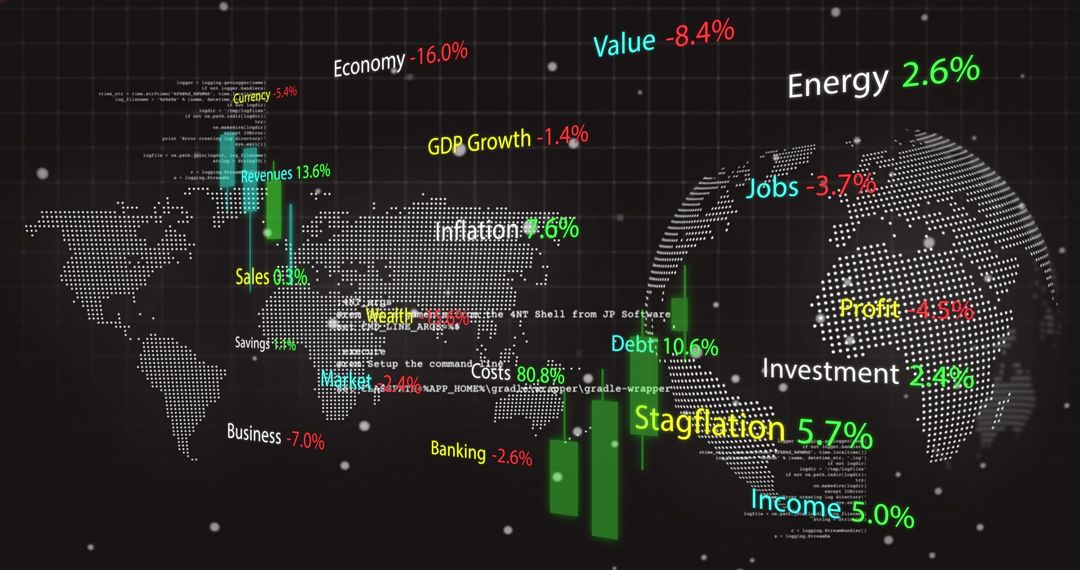
This vibrant illustration presents a high-tech portrayal of financial and economic data via bar and candlestick charts, illuminated by varying metrics related to global conditions. The floating text highlights important terms like GDP growth, inflation, investment, competition, energy, and blinds comparisons with a backdrop noted by a stylized global map. Ideal for visual presentations reflecting economic fluctuations or financial investments, designed for business website augmentation or infographic enhancement in presentations exploring analytical financial foundations or economic status pictorials.
Powered by 


2
downloads
downloads
Tags:
More
Credit Photo
If you would like to credit the Photo, here are some ways you can do so
Text Link
photo Link
<span class="text-link">
<span>
<a target="_blank" href=https://pikwizard.com/photo/global-financial-metrics-on-digital-dashboard-with-charts-and-visual-data/7f20b2892e31b0598f949ec113fd2635/>PikWizard</a>
</span>
</span>
<span class="image-link">
<span
style="margin: 0 0 20px 0; display: inline-block; vertical-align: middle; width: 100%;"
>
<a
target="_blank"
href="https://pikwizard.com/photo/global-financial-metrics-on-digital-dashboard-with-charts-and-visual-data/7f20b2892e31b0598f949ec113fd2635/"
style="text-decoration: none; font-size: 10px; margin: 0;"
>
<img src="https://pikwizard.com/pw/medium/7f20b2892e31b0598f949ec113fd2635.jpg" style="margin: 0; width: 100%;" alt="" />
<p style="font-size: 12px; margin: 0;">PikWizard</p>
</a>
</span>
</span>
Free (free of charge)
Free for personal and commercial use.
Author: Creative Art
Similar Free Stock Images
Premium


Premium


Premium


Premium


Premium


Premium


Premium


Premium


Premium


Premium


Premium


Premium


Premium


Premium


Premium


Premium


Premium


Premium


Premium


Premium


Premium


Premium


Premium


Premium