- Home >
- Stock Photos >
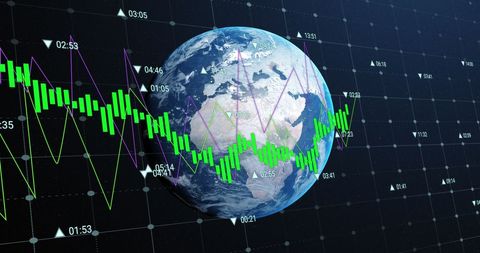
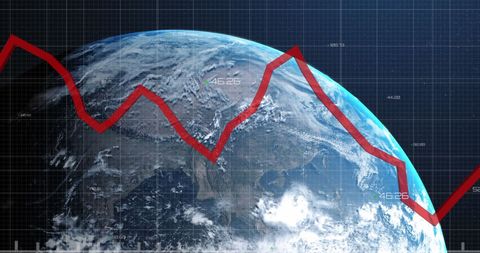
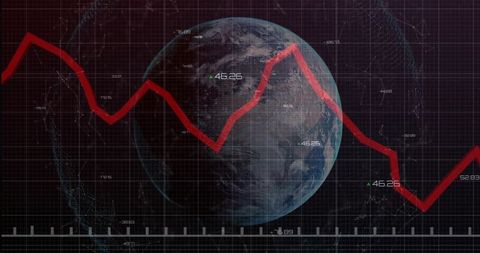
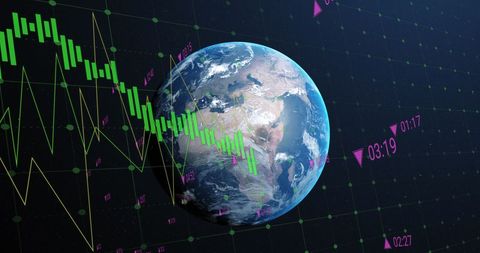
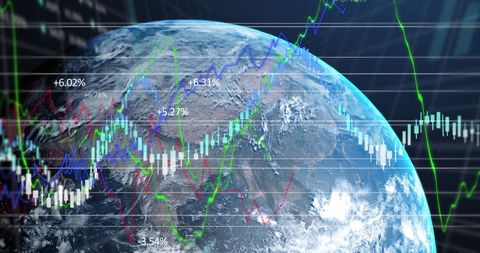
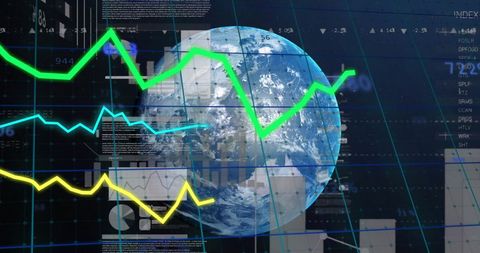
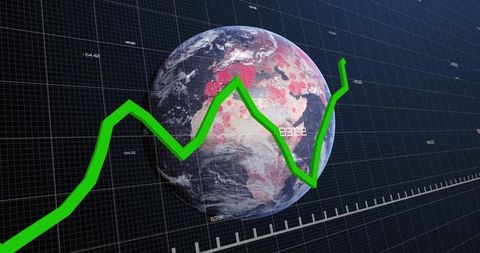
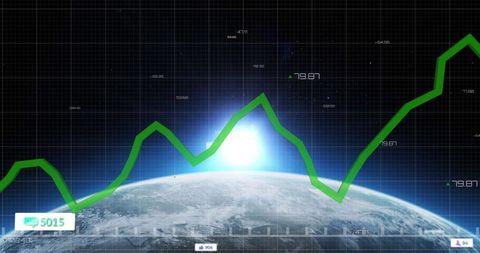
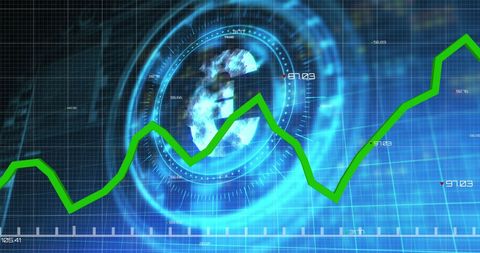
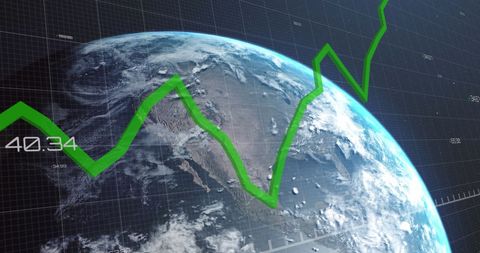
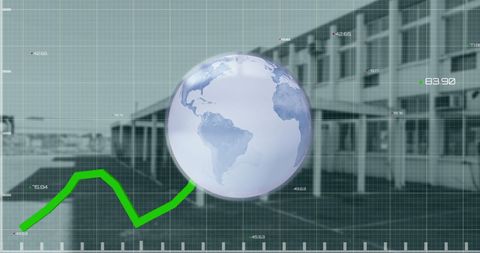
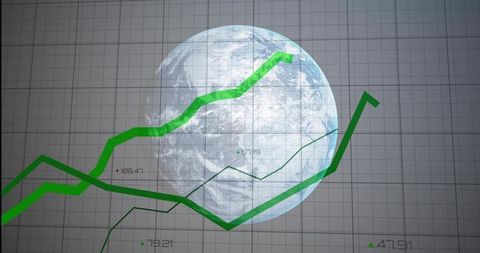
- Global Financial Trends Represented with Earth and Chart
Global Financial Trends Represented with Earth and Chart Image
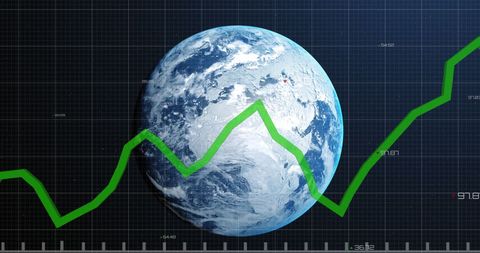
Visual representation of worldwide financial trends showing green line graph spanning Earth's globe. Useful for illustrating global business or economy concepts, finance reports, or articles examining international economic data.
Powered by 


2
downloads
downloads
Tags:
More
Credit Photo
If you would like to credit the Photo, here are some ways you can do so
Text Link
photo Link
<span class="text-link">
<span>
<a target="_blank" href=https://pikwizard.com/photo/global-financial-trends-represented-with-earth-and-chart/15fcb62a6faa2eb0b87983e7b5ab7497/>PikWizard</a>
</span>
</span>
<span class="image-link">
<span
style="margin: 0 0 20px 0; display: inline-block; vertical-align: middle; width: 100%;"
>
<a
target="_blank"
href="https://pikwizard.com/photo/global-financial-trends-represented-with-earth-and-chart/15fcb62a6faa2eb0b87983e7b5ab7497/"
style="text-decoration: none; font-size: 10px; margin: 0;"
>
<img src="https://pikwizard.com/pw/medium/15fcb62a6faa2eb0b87983e7b5ab7497.jpg" style="margin: 0; width: 100%;" alt="" />
<p style="font-size: 12px; margin: 0;">PikWizard</p>
</a>
</span>
</span>
Free (free of charge)
Free for personal and commercial use.
Author: Creative Art
Similar Free Stock Images

Premium


Premium


Premium


Premium

Premium


Premium


Premium


Premium


Premium


Premium


Premium


Premium


Premium


Premium


Premium


Premium


Premium


Premium


Premium


Premium


Premium


Premium


Premium

Premium


Premium