
- Home >
- Stock Photos >
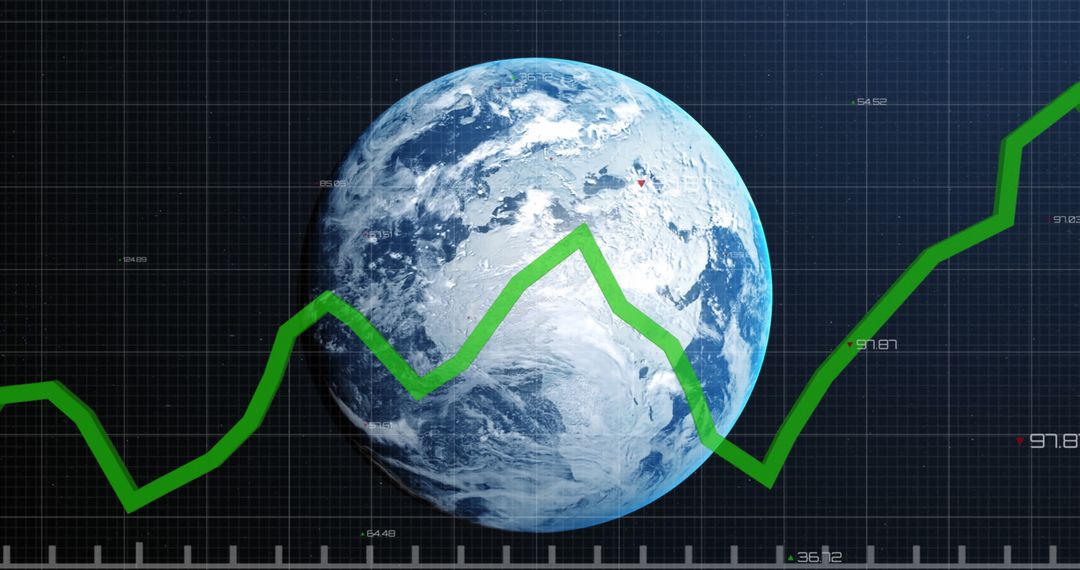
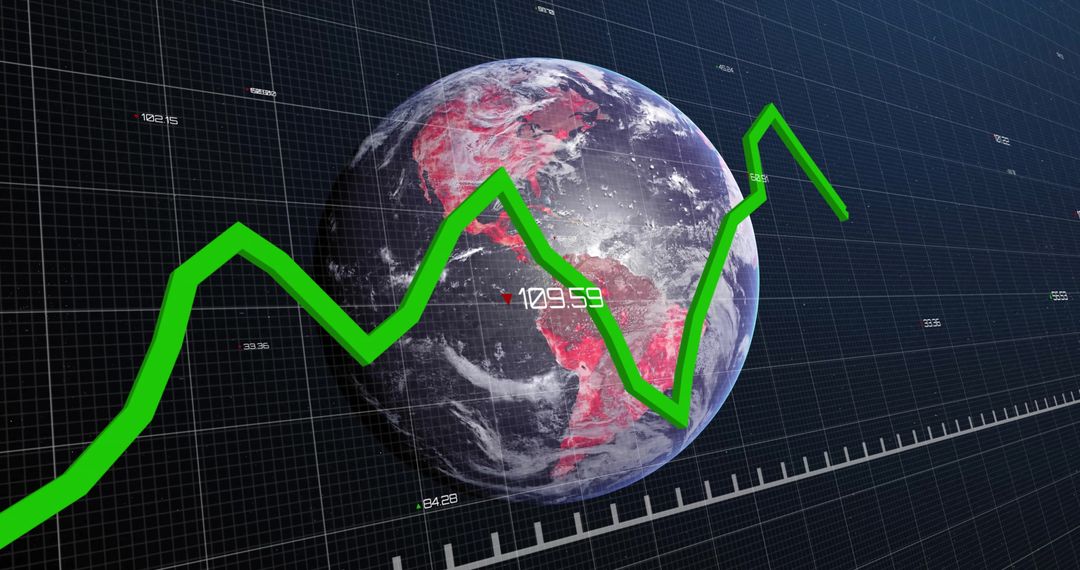
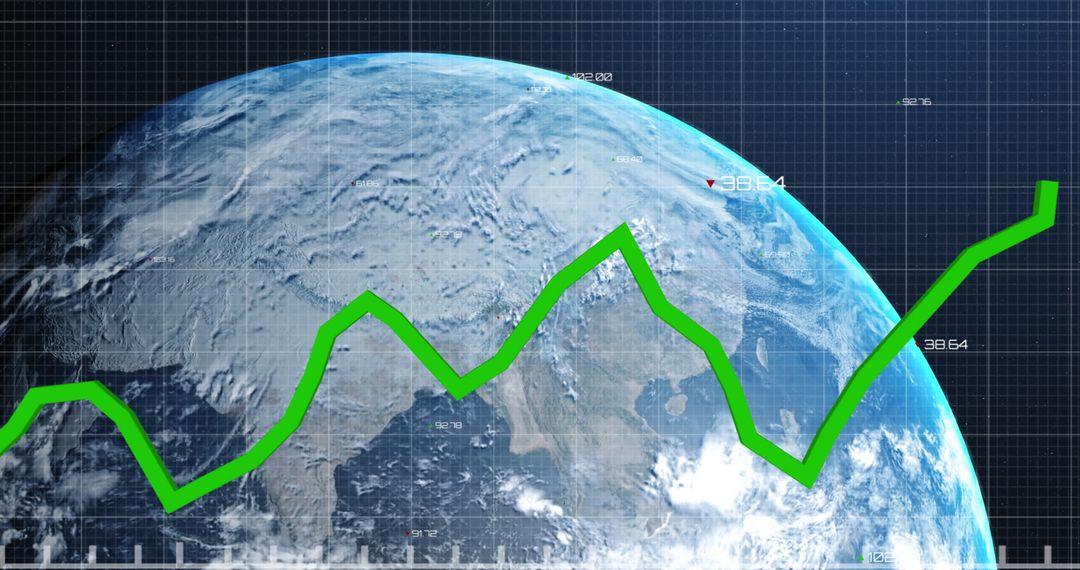
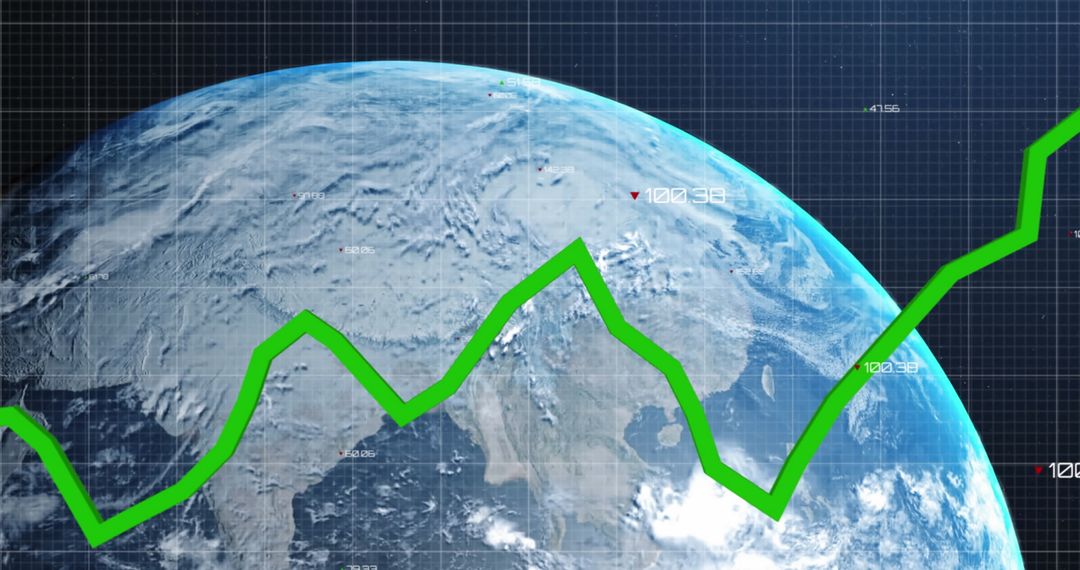
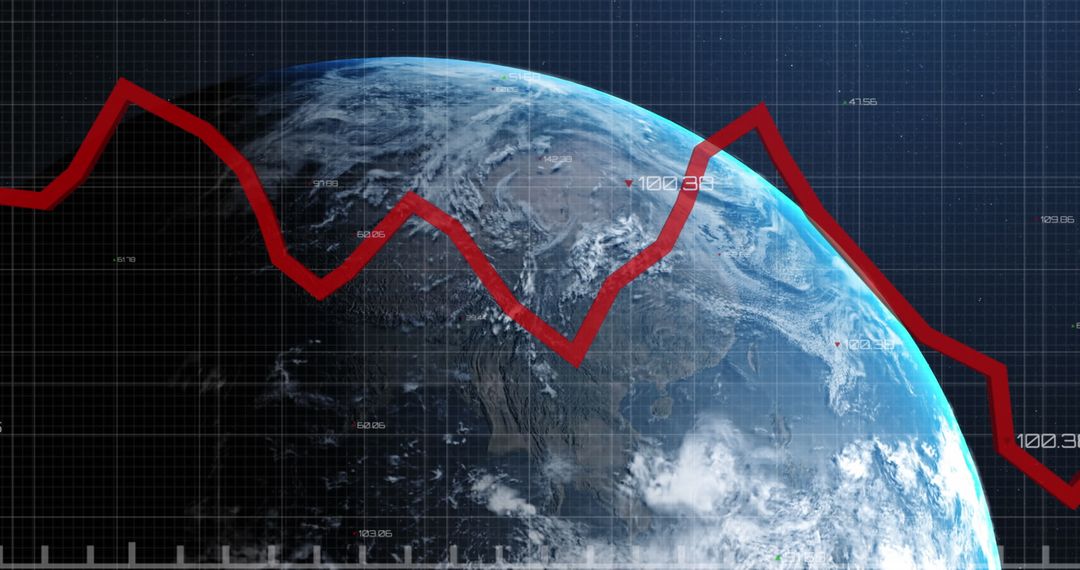
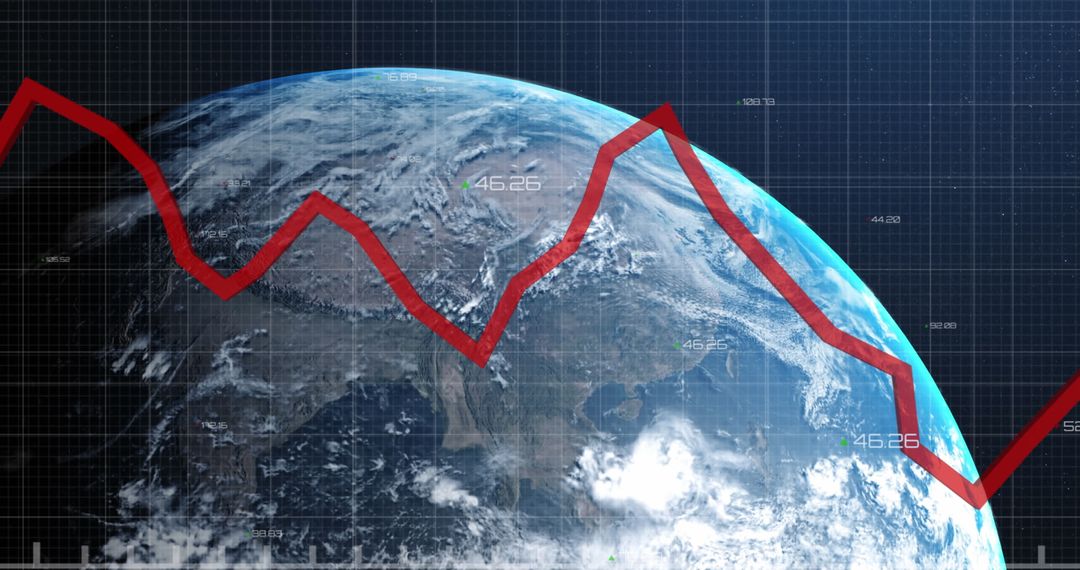
- Global Financial Trends with Upward and Downward Projections
Global Financial Trends with Upward and Downward Projections Image

Digitally generated concept illustrating global financial data analysis against Earth backdrop. Blue lines symbolize stocks or trends fluctuating, ideal for depicting economic reports or articles about market behaviors. Useful for financial newsletters, educational materials, and global investment presentations.
Powered by  - Get 15% off with code: PIKWIZARD15


2
downloads
downloads
Tags:
More
Credit Photo
If you would like to credit the Photo, here are some ways you can do so
Text Link
photo Link
<span class="text-link">
<span>
<a target="_blank" href=https://pikwizard.com/photo/global-financial-trends-with-upward-and-downward-projections/125dbf67b855fdf29abb21119b656521/>PikWizard</a>
</span>
</span>
<span class="image-link">
<span
style="margin: 0 0 20px 0; display: inline-block; vertical-align: middle; width: 100%;"
>
<a
target="_blank"
href="https://pikwizard.com/photo/global-financial-trends-with-upward-and-downward-projections/125dbf67b855fdf29abb21119b656521/"
style="text-decoration: none; font-size: 10px; margin: 0;"
>
<img src="https://pikwizard.com/pw/medium/125dbf67b855fdf29abb21119b656521.jpg" style="margin: 0; width: 100%;" alt="" />
<p style="font-size: 12px; margin: 0;">PikWizard</p>
</a>
</span>
</span>
Free (free of charge)
Free for personal and commercial use.
Author: People Creations
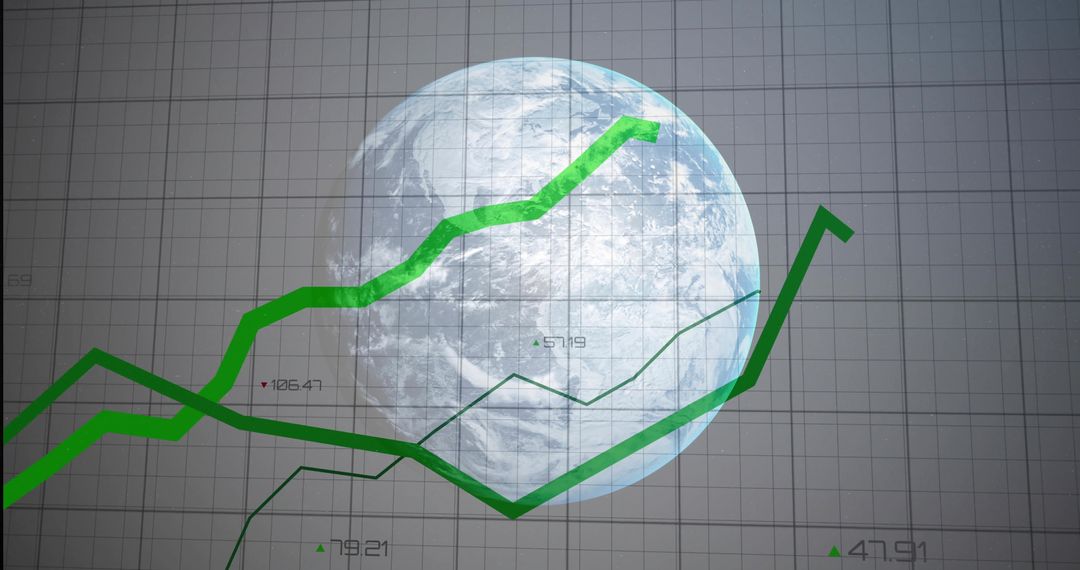
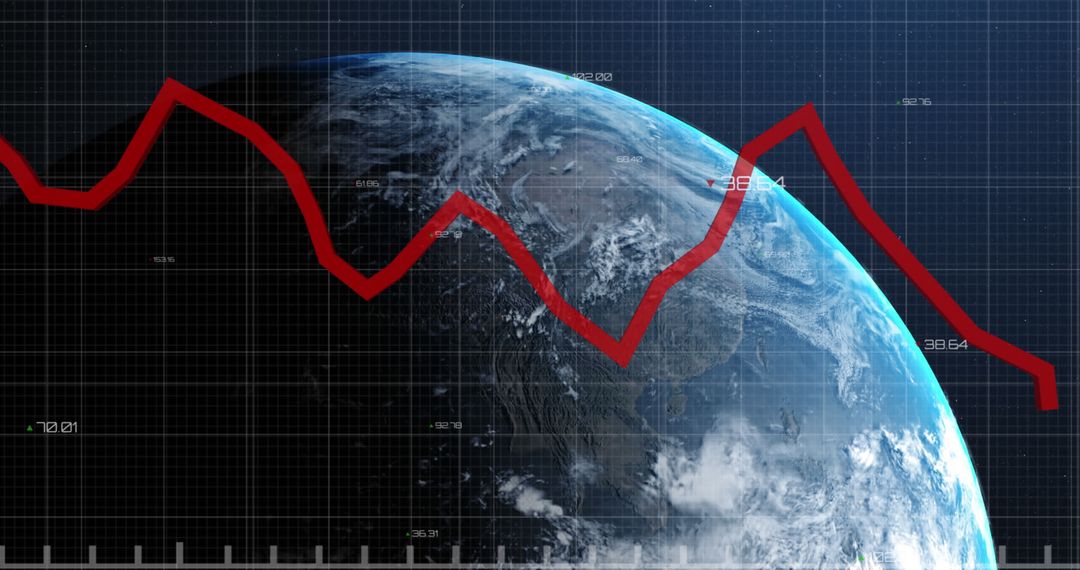
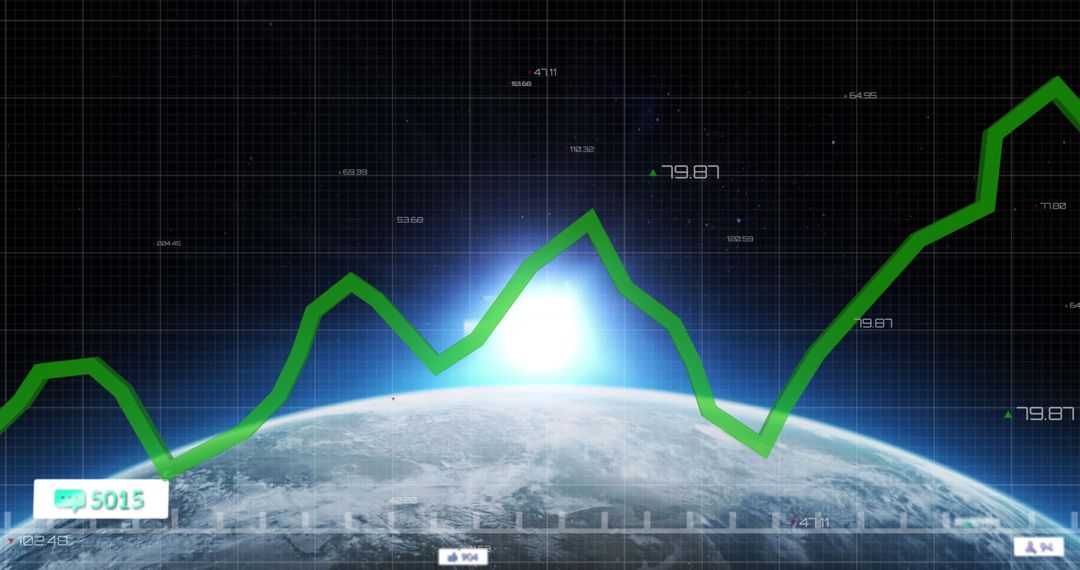
Similar Free Stock Images

Premium


Premium


Premium


Premium


Premium


Premium


Premium


Premium


Premium


Premium


Premium


Premium


Premium


Premium


Premium


Premium


Premium


Premium


Premium


Premium


Premium


Premium


Premium


Premium

