
- Home >
- Stock Photos >
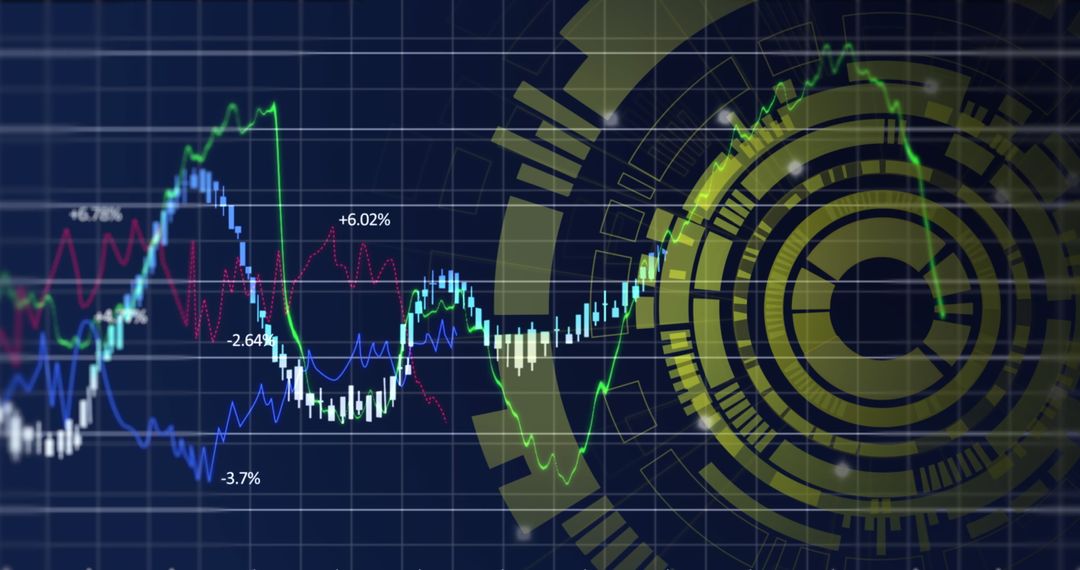
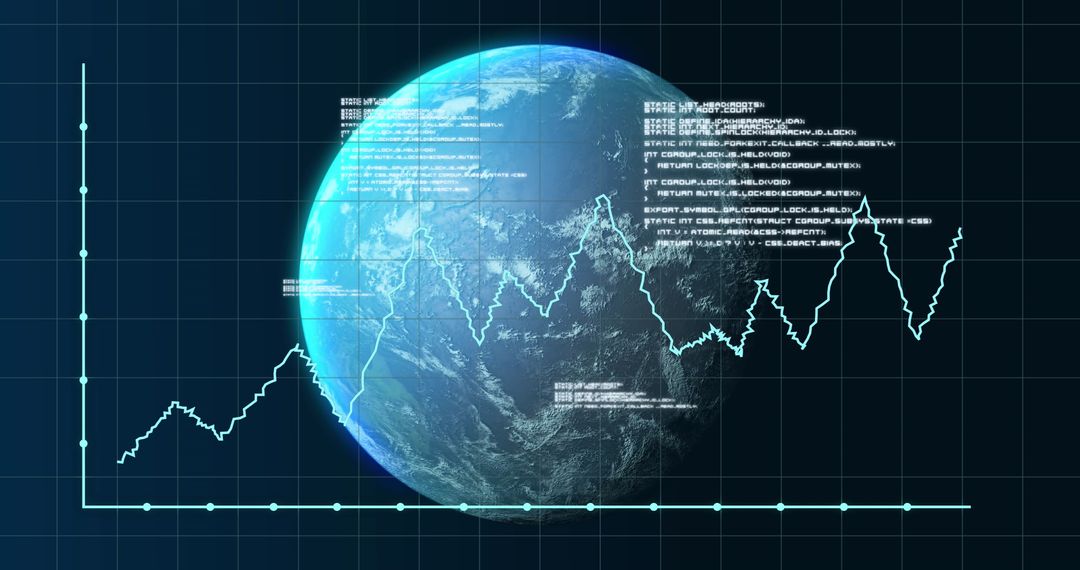
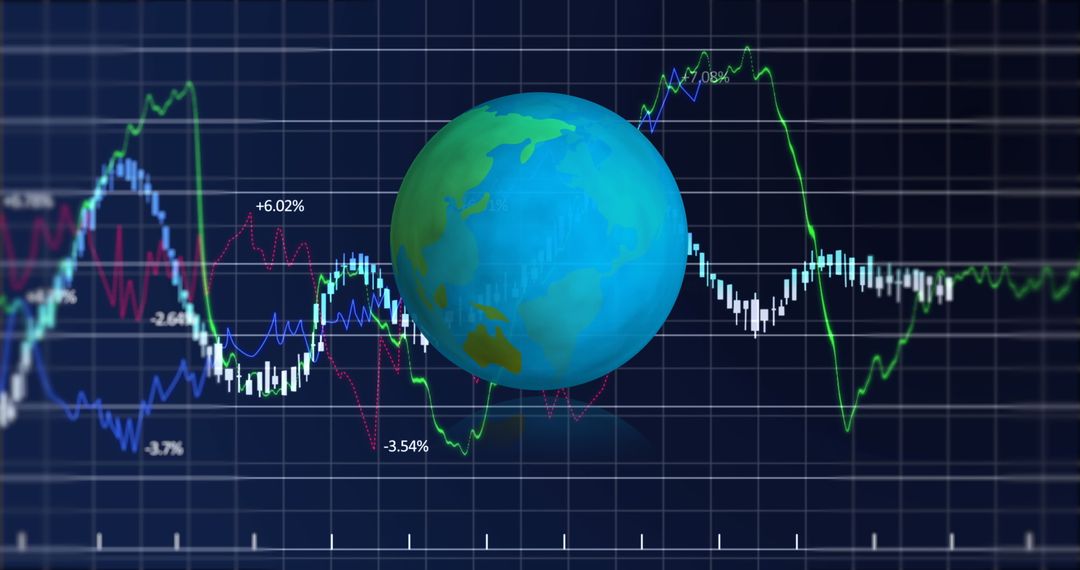
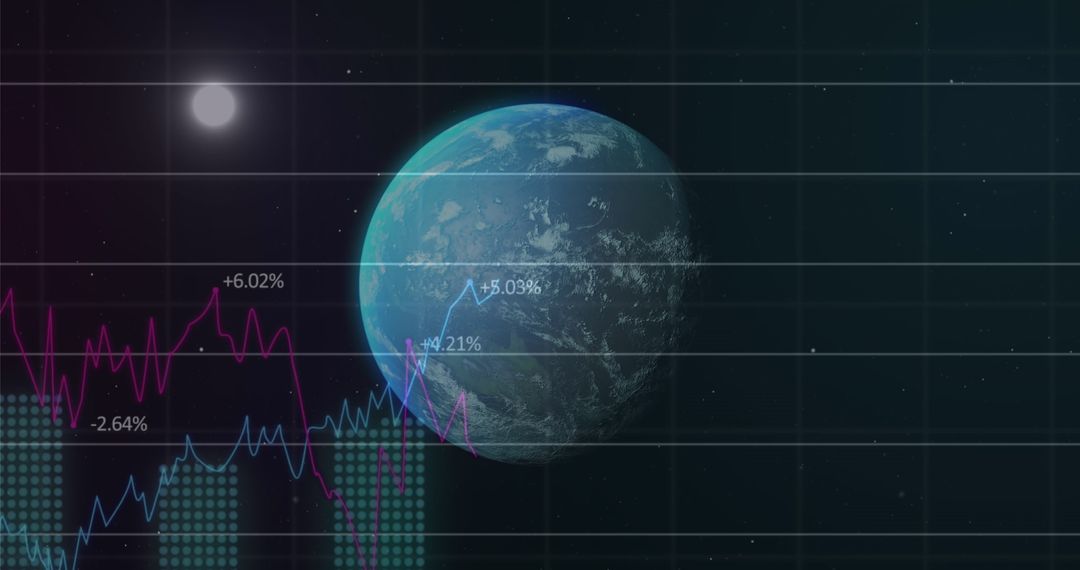
- Global market dashboard displaying candlestick charts, trend lines, percent labels
Global market dashboard displaying candlestick charts, trend lines, percent labels Image

High-tech finance graphic featuring candlestick bars, colored trend lines, percent change annotations and translucent globe overlay on dark grid. Useful for presenting market analysis, financial reports, trading platform UI, fintech website hero, investment blog header, investor pitch deck and educational resources explaining technical analysis. Work well as banner, slide background, article header or social post; crop to emphasize candlestick cluster or globe for alternate compositions. Pair with bold sans-serif headline and contrasting accent color for strong call-to-action. Suitable for topics covering stock market, cryptocurrency, global finance, market research and business analytics.
Powered by  - Get 15% off with code: PIKWIZARD15


0
downloads
downloads
Tags:
More
Credit Photo
If you would like to credit the Photo, here are some ways you can do so
Text Link
photo Link
<span class="text-link">
<span>
<a target="_blank" href=https://pikwizard.com/photo/global-market-dashboard-displaying-candlestick-charts-trend-lines-percent-labels/1f92158593a24aaaae4c0455e7545519/>PikWizard</a>
</span>
</span>
<span class="image-link">
<span
style="margin: 0 0 20px 0; display: inline-block; vertical-align: middle; width: 100%;"
>
<a
target="_blank"
href="https://pikwizard.com/photo/global-market-dashboard-displaying-candlestick-charts-trend-lines-percent-labels/1f92158593a24aaaae4c0455e7545519/"
style="text-decoration: none; font-size: 10px; margin: 0;"
>
<img src="https://pikwizard.com/pw/medium/1f92158593a24aaaae4c0455e7545519.jpg" style="margin: 0; width: 100%;" alt="" />
<p style="font-size: 12px; margin: 0;">PikWizard</p>
</a>
</span>
</span>
Free (free of charge)
Free for personal and commercial use.
Author: Creative Art
Similar Free Stock Images

Premium


Premium


Premium


Premium


Premium


Premium


Premium


Premium


Premium


Premium


Premium


Premium


Premium


Premium


Premium


Premium


Premium


Premium


Premium


Premium


Premium


Premium


Premium


Premium

