- Home >
- Stock Photos >
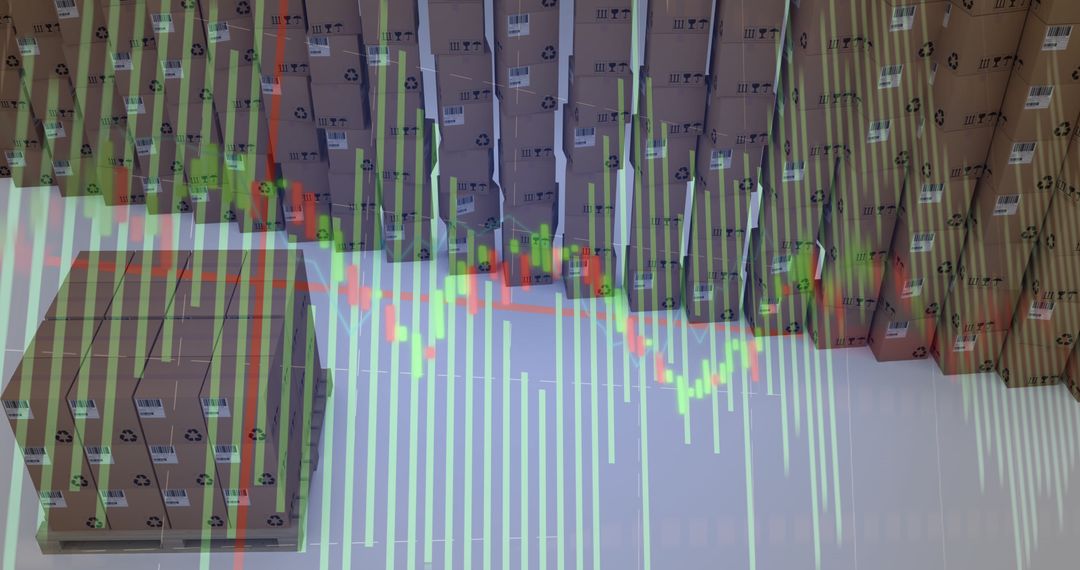
- Global Shipping Data Analytics Over Cardboard Boxes
Global Shipping Data Analytics Over Cardboard Boxes Image

Abstract integration of logistics and data analytics. Perfect for illustrating concepts in global trade, supply chain management, and the intersection of technology and business.
Powered by 


6
downloads
downloads
Tags:
More
Credit Photo
If you would like to credit the Photo, here are some ways you can do so
Text Link
photo Link
<span class="text-link">
<span>
<a target="_blank" href=https://pikwizard.com/photo/global-shipping-data-analytics-over-cardboard-boxes/363c5f2795b1152e386de5206813e0ec/>PikWizard</a>
</span>
</span>
<span class="image-link">
<span
style="margin: 0 0 20px 0; display: inline-block; vertical-align: middle; width: 100%;"
>
<a
target="_blank"
href="https://pikwizard.com/photo/global-shipping-data-analytics-over-cardboard-boxes/363c5f2795b1152e386de5206813e0ec/"
style="text-decoration: none; font-size: 10px; margin: 0;"
>
<img src="https://pikwizard.com/pw/medium/363c5f2795b1152e386de5206813e0ec.jpg" style="margin: 0; width: 100%;" alt="" />
<p style="font-size: 12px; margin: 0;">PikWizard</p>
</a>
</span>
</span>
Free (free of charge)
Free for personal and commercial use.
Author: Authentic Images
Similar Free Stock Images

Premium


Premium


Premium


Premium


Premium


Premium


Premium


Premium


Premium


Premium


Premium


Premium


Premium


Premium


Premium


Premium


Premium


Premium


Premium


Premium


Premium


Premium


Premium


Premium