- Home >
- Stock Photos >
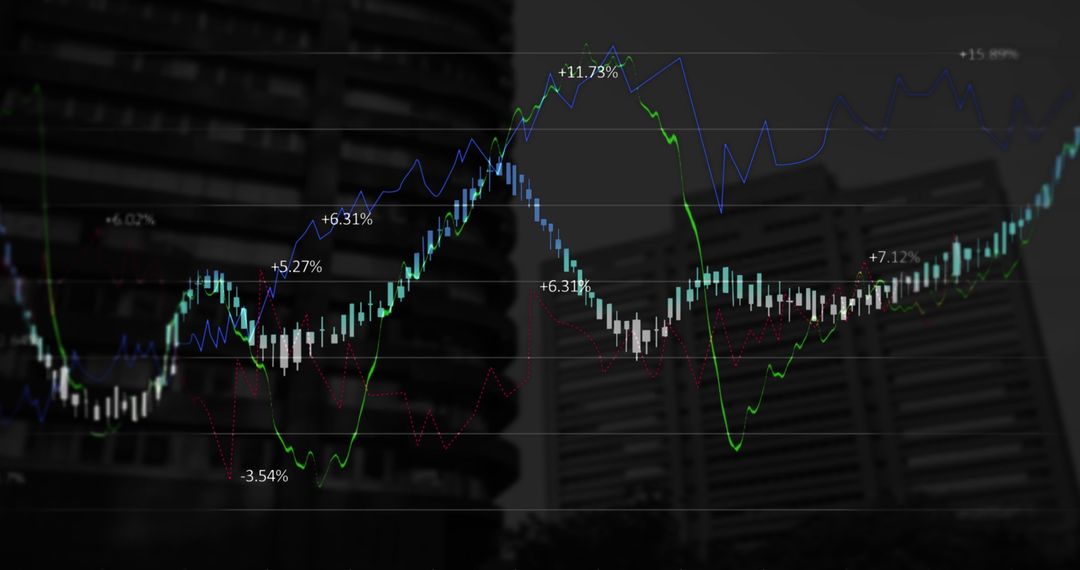
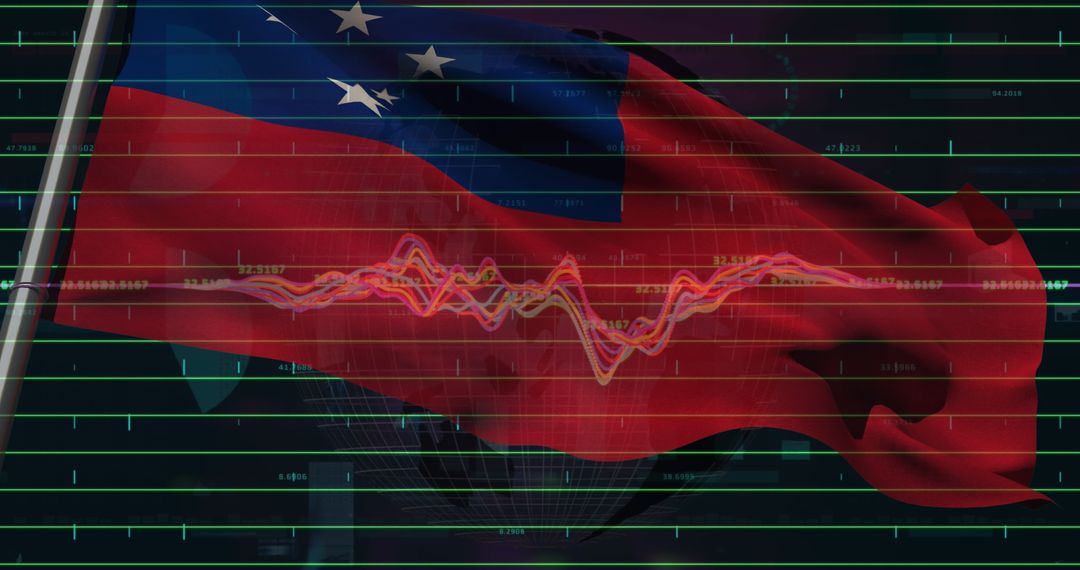
- Global Stock Market Challenges Displayed with U.S. and Taiwan Flags
Global Stock Market Challenges Displayed with U.S. and Taiwan Flags Image
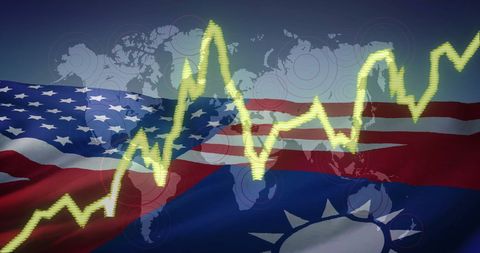
Image showcases fluctuating stock market data overlaid on American and Taiwanese flags with a world map backdrop. Represents global economic interactions, investment trends, and financial analysis. Useful for illustrations in finance articles, investment reports, and presentations on international trading efforts.
Powered by  - Get 15% off with code: PIKWIZARD15


2
downloads
downloads
Tags:
More
Credit Photo
If you would like to credit the Photo, here are some ways you can do so
Text Link
photo Link
<span class="text-link">
<span>
<a target="_blank" href=https://pikwizard.com/photo/global-stock-market-challenges-displayed-with-u-s-and-taiwan-flags/1fe4f0ab77de1b876d65b6058b15c039/>PikWizard</a>
</span>
</span>
<span class="image-link">
<span
style="margin: 0 0 20px 0; display: inline-block; vertical-align: middle; width: 100%;"
>
<a
target="_blank"
href="https://pikwizard.com/photo/global-stock-market-challenges-displayed-with-u-s-and-taiwan-flags/1fe4f0ab77de1b876d65b6058b15c039/"
style="text-decoration: none; font-size: 10px; margin: 0;"
>
<img src="https://pikwizard.com/pw/medium/1fe4f0ab77de1b876d65b6058b15c039.jpg" style="margin: 0; width: 100%;" alt="" />
<p style="font-size: 12px; margin: 0;">PikWizard</p>
</a>
</span>
</span>
Free (free of charge)
Free for personal and commercial use.
Author: Authentic Images
Similar Free Stock Images

Premium


Premium


Premium


Premium


Premium


Premium


Premium


Premium


Premium


Premium


Premium


Premium


Premium


Premium


Premium


Premium


Premium


Premium


Premium


Premium


Premium


Premium


Premium


Premium