- Home >
- Stock Photos >
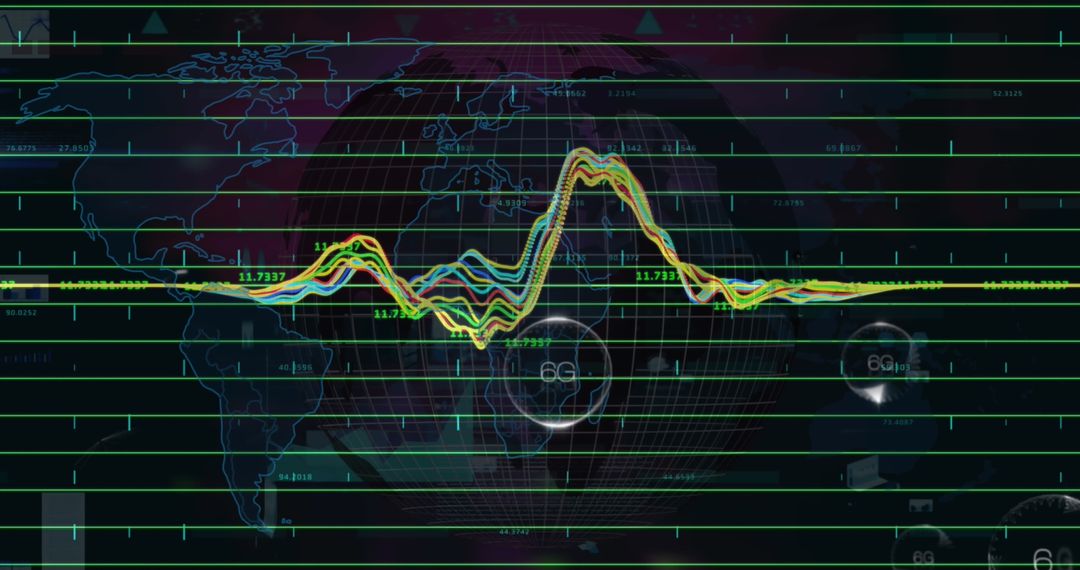
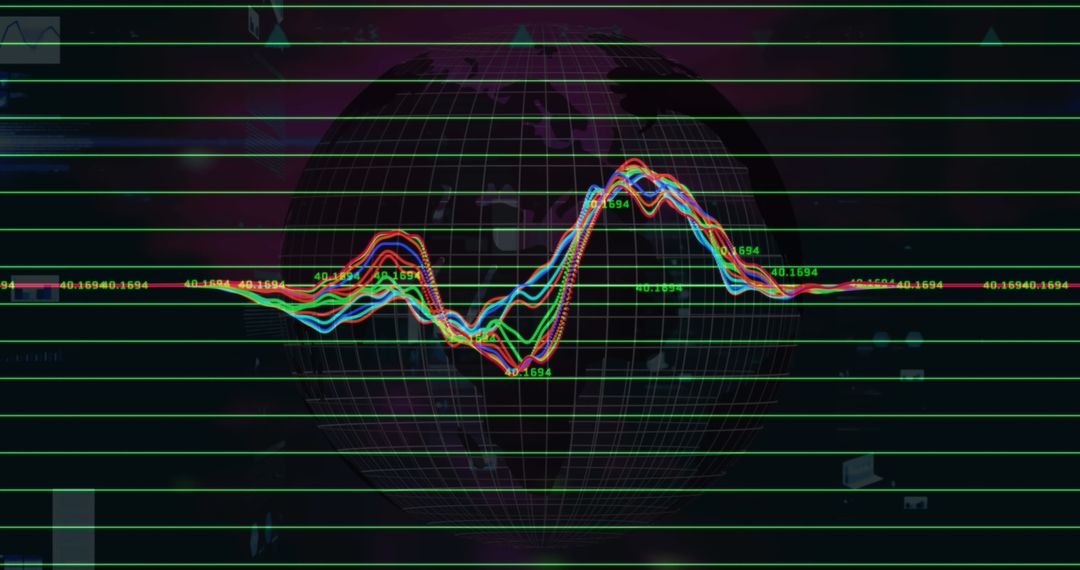
- Glowing Data Graph Overlay on Spinning Black Globe
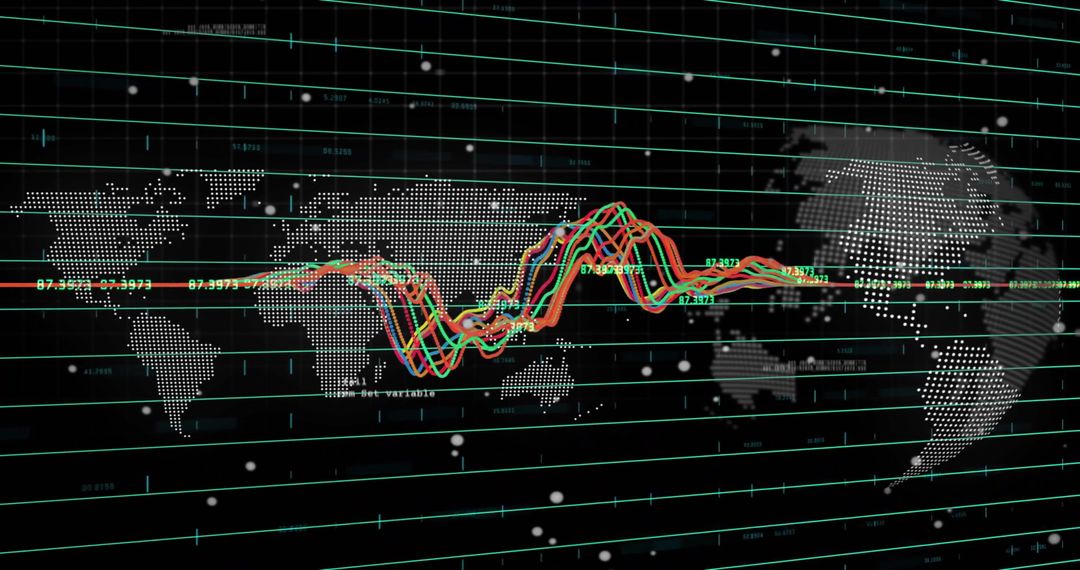
Glowing Data Graph Overlay on Spinning Black Globe Image

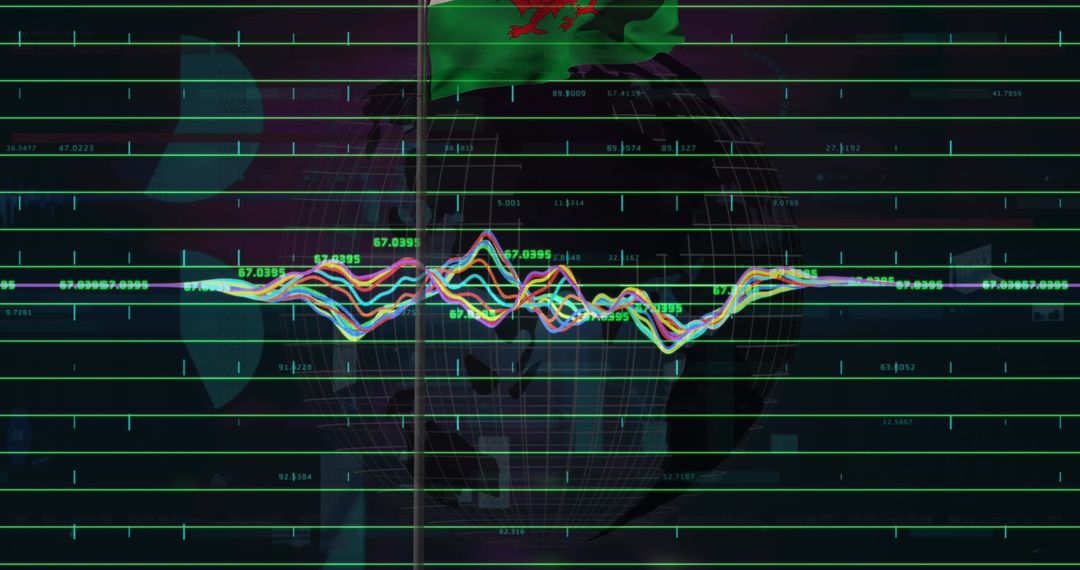
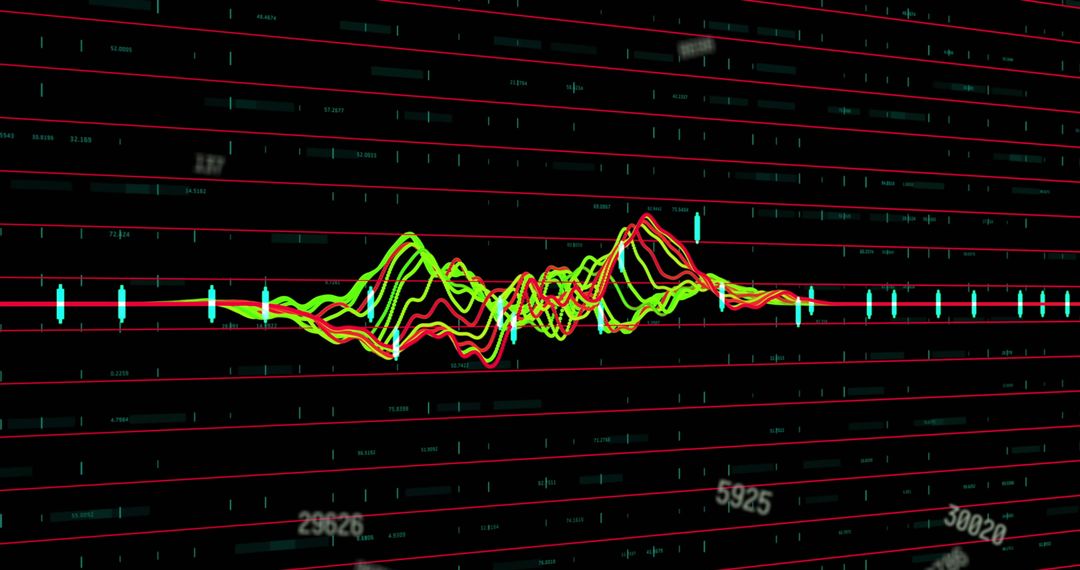
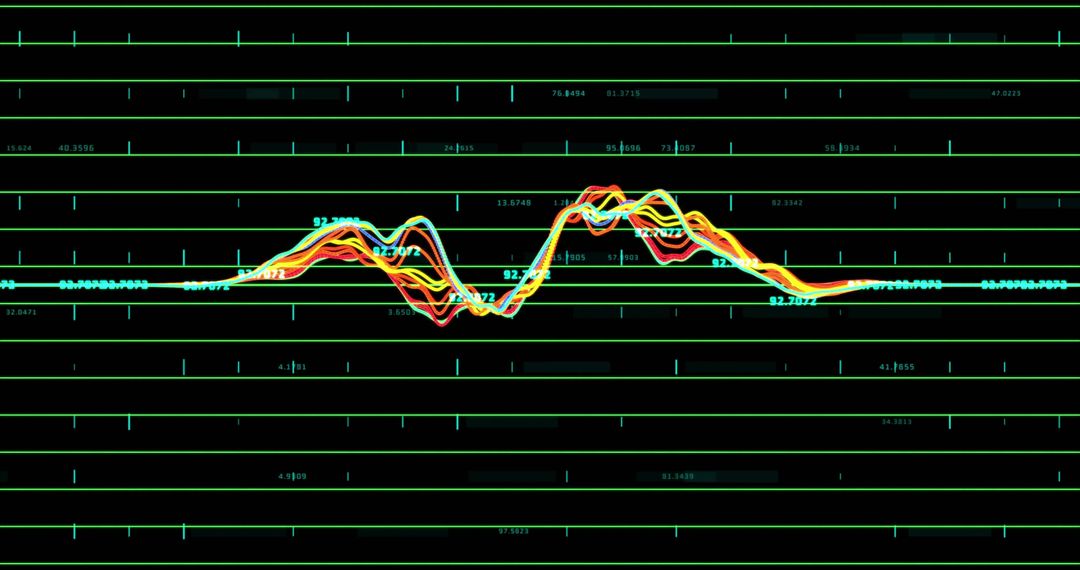
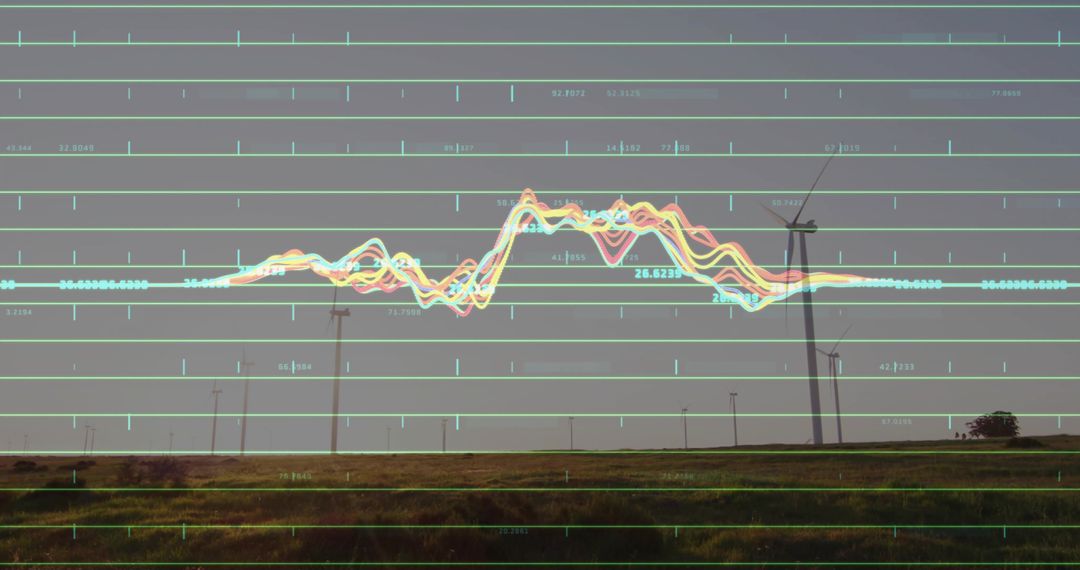
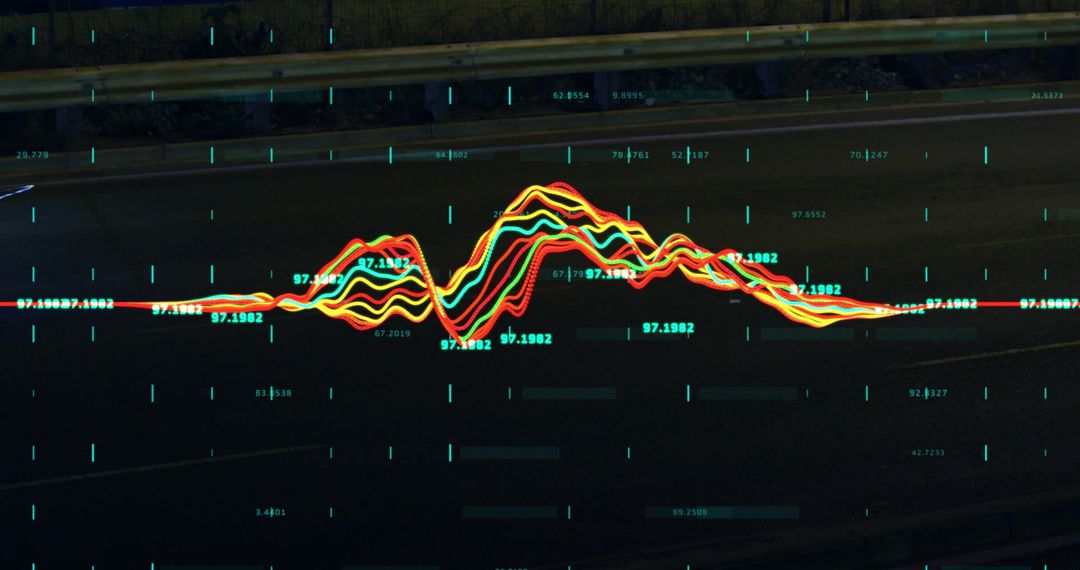
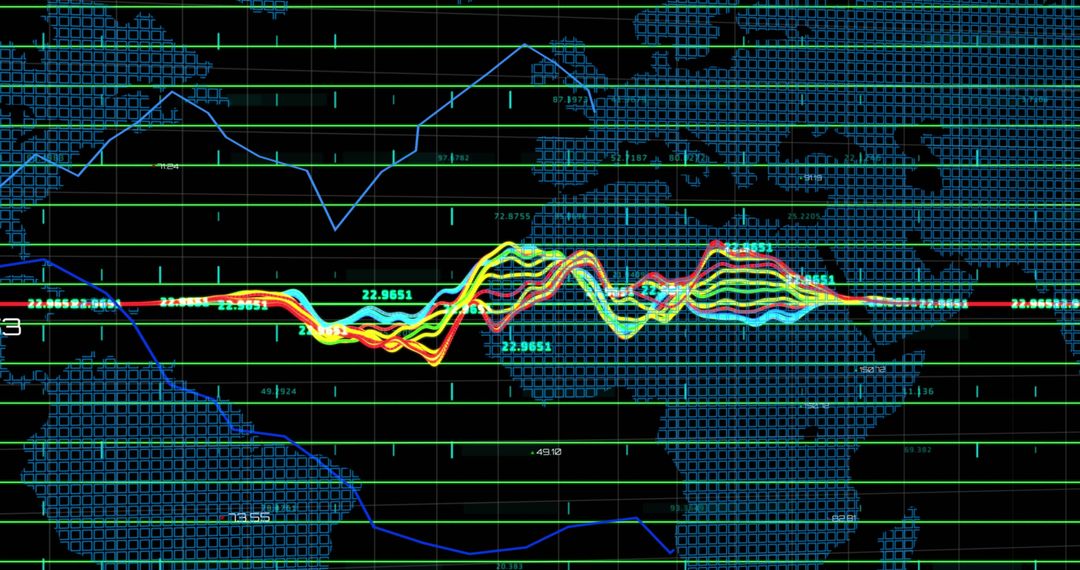
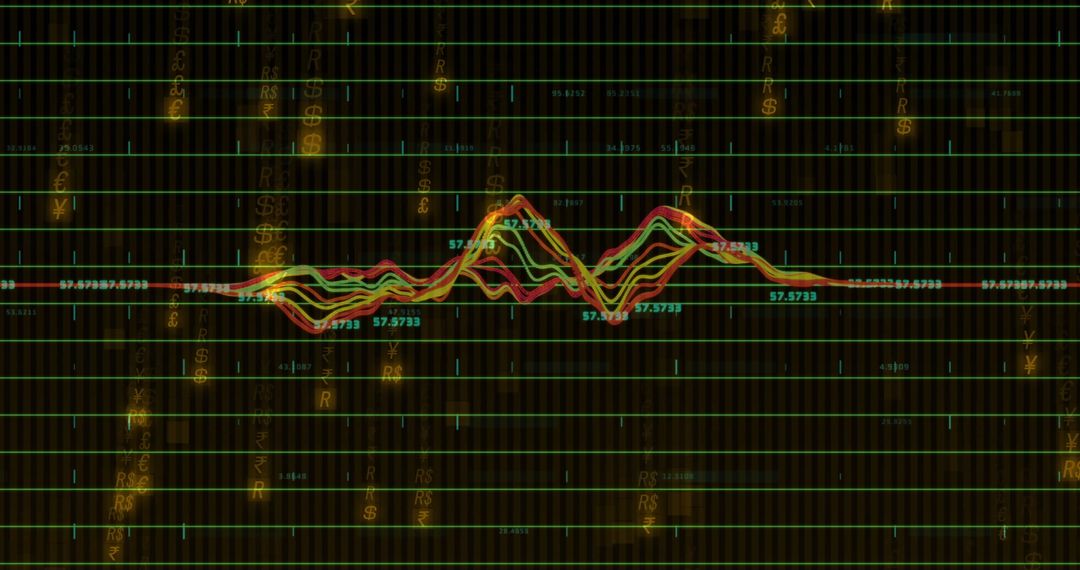
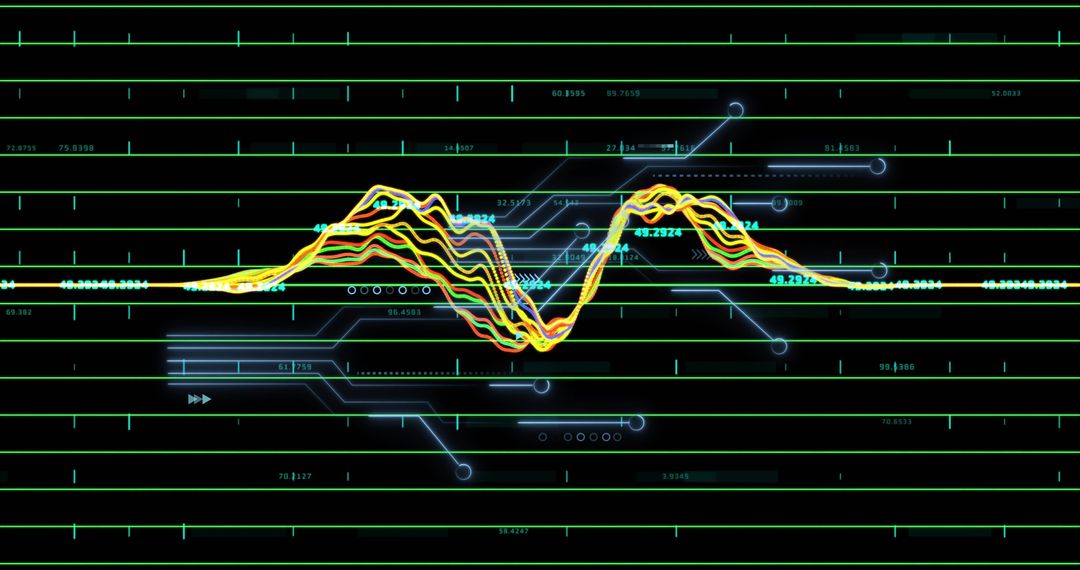
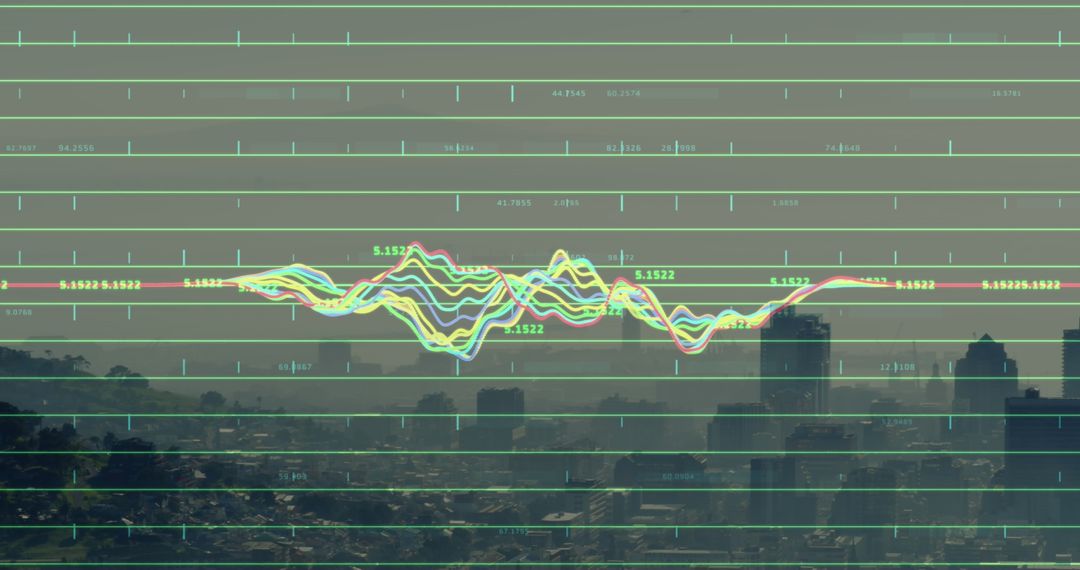
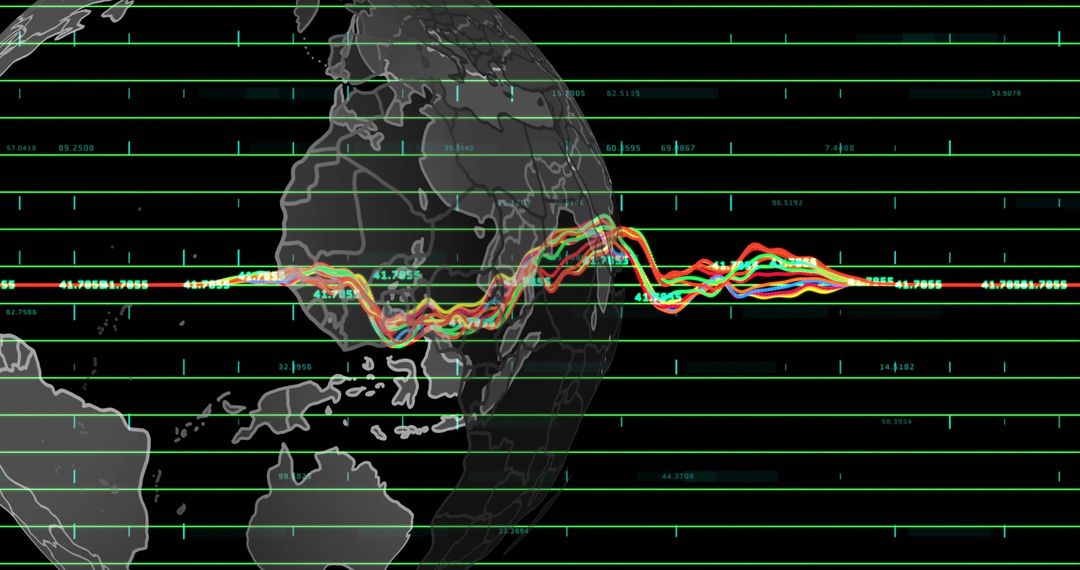
Glowing, multicolored data lines overlay a spinning black globe, representing global connections and technology. Lines form a graph, indicative of analytics and financial chart analysis. This visual perfectly illustrates networking and real-time data assessment. Ideal usage includes technology marketing material, financial reports, and presentations about data analytics, global networks, and business strategy.
Powered by  - Get 15% off with code: PIKWIZARD15


2
downloads
downloads
Tags:
More
Credit Photo
If you would like to credit the Photo, here are some ways you can do so
Text Link
photo Link
<span class="text-link">
<span>
<a target="_blank" href=https://pikwizard.com/photo/glowing-data-graph-overlay-on-spinning-black-globe/5290132becab4028329b1726a8f17212/>PikWizard</a>
</span>
</span>
<span class="image-link">
<span
style="margin: 0 0 20px 0; display: inline-block; vertical-align: middle; width: 100%;"
>
<a
target="_blank"
href="https://pikwizard.com/photo/glowing-data-graph-overlay-on-spinning-black-globe/5290132becab4028329b1726a8f17212/"
style="text-decoration: none; font-size: 10px; margin: 0;"
>
<img src="https://pikwizard.com/pw/medium/5290132becab4028329b1726a8f17212.jpg" style="margin: 0; width: 100%;" alt="" />
<p style="font-size: 12px; margin: 0;">PikWizard</p>
</a>
</span>
</span>
Free (free of charge)
Free for personal and commercial use.
Author: People Creations
Similar Free Stock Images

Premium


Premium


Premium


Premium


Premium


Premium


Premium


Premium


Premium


Premium


Premium


Premium


Premium


Premium


Premium


Premium


Premium


Premium


Premium


Premium


Premium


Premium


Premium


Premium