1. Home > 
  2. Stock Photos > 
  3. Glowing Financial Graphs and Stock Market Analysis

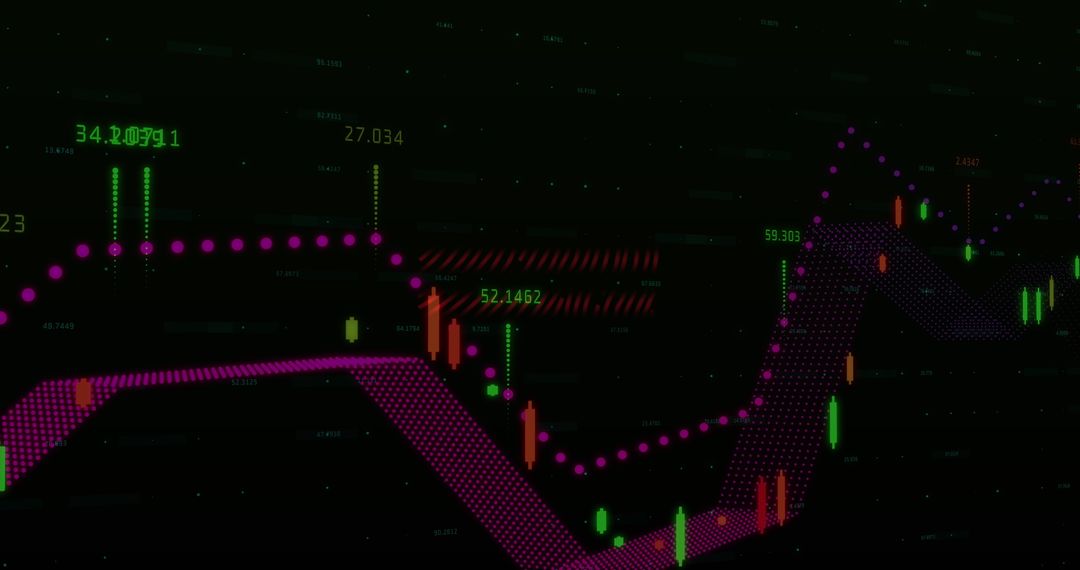
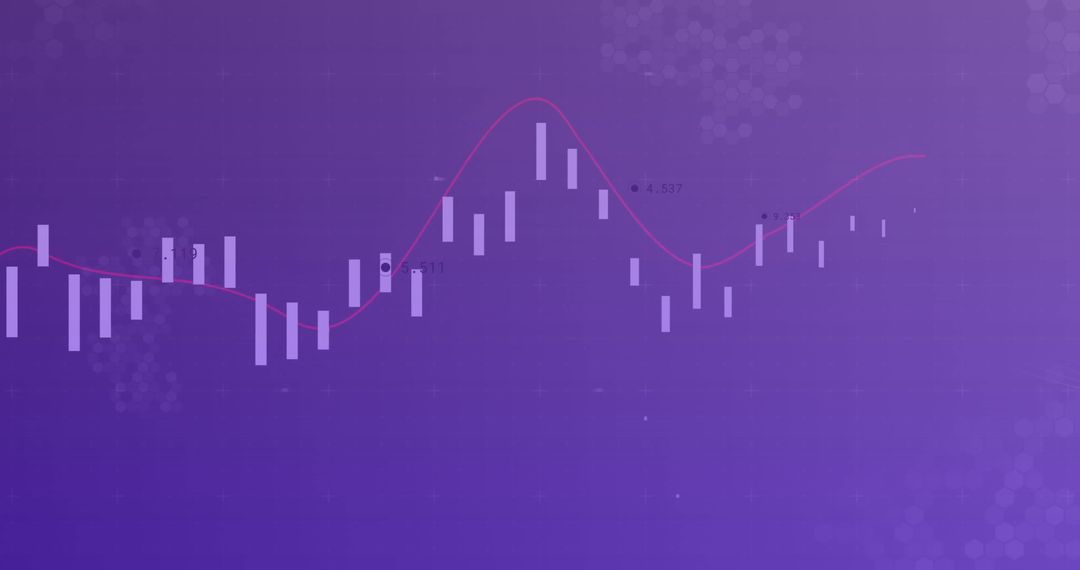
Glowing Financial Graphs and Stock Market Analysis Image

Glowing Financial Graphs and Stock Market Analysis

Depicting dynamic stock market analysis with illuminated graphs, illustrating fluctuating trends of financial data. Useful for financial reports, investment websites, and economic blogs aiming to visualize market dynamics and economic predictions. Enhances presentations to convey complex information elegantly.

Powered by Shutterstock logo - Get 15% off with code: PIKWIZARD15
Stock market or forex trading graph in futuristic concept suitable for financial investment or Economic trends business idea and all art work design. Abstract finance background - Powered by Shutterstock - Get 15% off with code: PIKWIZARD15Stock market analysis, business, finance and investment. Finance analyst analyzing stock market trading graph, economic growth chart, planning and strategy, business investment with financial report - Powered by Shutterstock - Get 15% off with code: PIKWIZARD15Online trading, Investment, Strategy market plan, and Stock mark - Powered by Shutterstock - Get 15% off with code: PIKWIZARD15Analysis finance grow graph and market  investment. Financial  business plan,earnings,sale and strategy. Stock market chart, exchange financial growth diagram. - Powered by Shutterstock - Get 15% off with code: PIKWIZARD15Stock market graph trading analysis investment financial, stock exchange financial or forex graph stock market graph chart business crisis crash loss and grow up gain and profits win up trend.  - Powered by Shutterstock - Get 15% off with code: PIKWIZARD15

Credit Photo

If you would like to credit the Photo, here are some ways you can do so

Free (free of charge)

Free for personal and commercial use.

Author: People Creations

Similar Free Stock Images

Colorful Stock Market Graph with LED Display Style
Premium
Stock market graph trading analysis investment financial, stock exchange financial or forex graph stock market graph chart business crisis crash loss and grow up gain and profits win up trend
Futuristic Digital Interface with Market Analysis
Dynamic Financial Data Analytics Interface with Blue Background
Dynamic Stock Market Chart Showing Fluctuating Financial Data
Digital Financial Data Visualization with Urban Cityscape
Premium
Stack of money coin and magnifying glass with graph and candle stick chart. Business and financial concept. Stock market analyzing, stock information search.
Digital Financial Data Processing Over Cityscape Background
Futuristic Data Processing Animation with Media Icons
Analyzing Data Trends with Futuristic Graph Interface
Dynamic Financial Data Analysis with Illuminated Graphs
Premium
Investors analyze the data stock market index via smartphone screen to trade the stock chart for planning investments take profit, trade stock exchange market and cryptocurrency data, financial.
Dynamic Data Visualization and Financial Growth Curves
Global Finance and COVID-19 Impact Representation
Dynamic Digital Market Analysis with Holographic Data
Abstract Financial Data Chart Over Urban Skyline
Premium
Stock market chart,Stock market data on LED display concept.
Dynamic Forex Trading Graphs with Increasing Numbers
Digital Analysis of Financial Data with Dynamic Graphs
Digital Data Chart on Grey Background with Red Trend Line
Futuristic Digital Data Graphs and World Map
Premium
Real estate, development and investing concept with financial chart indicators and stock market graphs on city skyscrapers tops bottom view, double exposure
Abstract Data Visualization on Blue Background for Technology Concept
Advanced Financial Data Network Over World Map
Financial Data Analysis with Abstract Chart Grid Overlay
Global Business Finance Data Analysis Visualization
Premium
Stock market exchange loss trading graph analysis investment indicator business graph charts of financial board display candlestick crisis stock crash red price chart fall money
Dynamic Financial Data with Interactive Graphs on Digital Screen
Dynamic Data Graphs Display on Dark Digital Background
Innovative Data Analysis over DNA Strand
Financial Data Analytics with Digital Visualization Concept
Colorful Digital Stock Market Graph on Grid Background
Financial Analysis with Digital Data and Vibrant Graph
Premium
abstract Financial chart with moving up growing stock market graph in blue light color background
Dynamic Digital Financial Data Interface Background
Financial Data Processing Visualization with Colorful Bar Charts
Financial Data Overlay on Cityscape Visualizing Market Trends
Digital Financial Graph with Dynamic Trading Analysis
Premium
Stock exchange market graph analysis background
Abstract Financial Data with Neon Line Graph and Candlestick Chart
Fluctuating Digital Stock Market Data Chart
Dynamic Stock Market Data on Digital Interface
Data Security with Tech Bar Graph Overlay
Premium
Financial stock market numbers and city light reflection
Financial Data and Blood Vessels Fusion Exploring Adaptive Business Intelligence
Abstract Digital Financial Data Chart with Pink Line Oscillations
Financial Data Over Cityscape with Glowing Graph Lines
Digital Financial Data Processing with Graphs and Charts
Premium
Businessman works on laptop Showing business analytics dashboard with charts, metrics, and KPI to analyze performance and create insight reports for operations management. Data analysis concept.Ai
Colorful Bar Graph with Data Overlay on Black Background
Dynamic Bar Graph Display of Financial Data Trends
Digital Graph with Rising and Falling Lines on Grid Background
Dynamic Financial Graphs and Data Analysis Interface
Premium
Business people analyze financial data chart trading forex, investing in stock markets, funds and digital assets, Business finance technology and investment concept, Business finance background.
Colorful Financial Graph with Digital Technology Concept
Financial Data Analysis on Blue Digital Interface
Analyzing Financial Data on Digital World Map Background
Declining Stock Market Graph with Digital Finance Concept
Premium
Stock market graph trading analysis investment financial In red, stock exchange financial or forex graph stock market graph chart business crisis crash loss and grow up gain and profits win up trend.
Abstract Digital Data Graph and Diagrams on Gray Background
Dynamic Financial Data with Fluctuating Graph Lines
Fluctuating Stock Market Graph with Dramatic Peaks
Colorful Digital Graph on World Map Depict Economic Trends
Dynamic Financial Data Visualization with Blue Trends
Rising Stock Market Trend with Digital Data Analytics
Premium
Businessman using laptop computer analyzing sales data and financial growth graph chart report. Business planning, strategy and development. Financial accounting. market research, data analysis
Vibrant Financial Data Analysis on Black Background
Dynamic Financial Graphs Over Cityscape Background
Abstract Financial Market Data Analysis Visualization
Futuristic Data Analysis with Chart and Digital Graphics
Premium
Double exposure image of coin stacks on technology financial graph background.Economy trends background for business ,financial meltdown ,Cryptocurrency digital economy.
Dynamic Financial Graph on Digital Background
Abstract Digital Market Analysis with Financial Charts
Stagflation Concept with Digital Graphs and Data Patterns
Digital Data Processing Background with Dynamic Lines
Premium
Concept of Modern Commercial Architecture and Financial Stock Market Securities Trends
Digital Financial Graph and City Silhouette Backdrop
Financial Data Analytics Over Urban Skyline Backdrop
Global Business Dashboard Overlay on Urban Skyline Background
Dynamic Financial Data Analysis in Digital Interface
Premium
Close up laptop screen view with stocks charts and graphs over shoulder of female crypto trader, analyze financial stock, makes trade market research, buy or sell cryptocurrency, review risk or profit
Colorful Financial Data Analytics and Global Market Trends
Dynamic Financial Data Against Urban Skyline
Futuristic Digital Waves Illustrating Complex Data Technology
Data Visualization on Blue Digital Interface
Premium
Using tablet pc, Consultant between bookkeepers and accounting lawyer consultation about asset, balance sheet, stock market statistics and yearly tax law, protect business from bribery.
Financial Data Graph with Digital Elements and Growth Indicators
Digital Stock Market Display with Data Analysis Graphics
Binary Code Data Over Financial Graph with Red Trends
Glowing Financial Graph with World Map in Dark Background
Premium
Businessman using pen touch candle chart financial growth of business and world economy. Stock market price increase. Stock market investment analysis, financial risk management and investment.
Purple Graphic Representation of Data Processing and Analysis
Global Financial Data Analysis with Green Growth Arrows on Blue Background
Abstract Financial Chart Technology Interface
Digital Financial Data Analysis with Chart and Markers
Digital Charts and Financial Data Background in Blue Tones
Dynamic Financial Data Display with Market Trends
Premium
Two diverse crypto traders brokers stock exchange market investors discussing trading charts research reports growth using pc computer looking at screen analyzing invest strategy, financial risks.
Dynamic Financial Data Elements on Abstarct Grid
Data Processing Visualization with Cityscape Background
Colorful Light Trails over Digital Data on Dark Background
Futuristic Data Analytics with Graphs and Charts
Premium
Stock market graph trading analysis investment financial, stock exchange financial or forex graph stock market graph chart business crisis crash loss and grow up gain and profits win up trend
Abstract Digital DNA Strand with Futuristic Data Codes
Abstract Digital Interface with Network Connections and Data Visualizations
Digital Graphs Representing Data and Analytics on Black Background
Digital Interface with Data Graphs and Charts on Blue Background
Premium
Financial technology and investment capital gain analytics with data of digital finance, stock market trends, fintech growth, and business performance using smart financial tools.
Visualizing Financial Data Trends Over Urban Backdrop
Digital Financial Data Over Cityscape Representation
Dynamic Digital Soundwave Pattern on Dark Background
Abstract Financial Data Visualization with Graphs
Premium
Stock market analysis, business, finance and investment. Finance analyst analyzing stock market trading graph, economic growth chart, planning and strategy, business investment with financial report.
Digital Data Flow Over Financial Cityscape
Dynamic Data Graph Overlay with Illuminated City Skyline
Data Analysis Graphics on Digital Grid Background
Abstract Financial Data Analysis and Stock Market Trends
Premium
Stock market and business activity in Asia. Corporate value and stock movement. Stock market prices charts on tall buildings background.
Upward Stock Market Arrow with Binary Code Background
Digital Financial Data Visualization over Circuit Board
Futuristic Data Processing on Digital Interface Concept
Abstract Data Graph with Dynamic Charts and Indicators
Premium
Analyst working with Financial Data and Business Analytics Dashboard on computer to make Financial Report with KPI and Metrics. Investment, Corporate Finance, Strategy, Operations, Sales.
Financial Data Analysis with Graphs on Grey Background