1. Home > 
  2. Stock Photos > 
  3. Gold Coin Stack with Financial Charts Overlay Showing Pink Candlesticks and Line Graphs

Gold Coin Stack with Financial Charts Overlay Showing Pink Candlesticks and Line Graphs Image

Gold Coin Stack with Financial Charts Overlay Showing Pink Candlesticks and Line Graphs

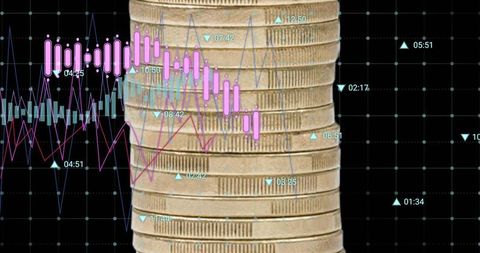
Showing stacked gold coins overlaid with pink candlestick series, blue and red line graphs, and cyan triangular markers on dark grid. Conveying concept of market performance, currency valuation, investment growth, and trading volatility. Perfect for illustrating financial reports, investor presentations, fintech dashboards, blog posts on market analysis, or social media campaigns promoting wealth management. Color palette and high contrast supporting clear data emphasis and headline overlay. Cropping and resizing working well for banners, hero sections, thumbnails, and presentation slides. Licensing suitable for commercial and editorial use.

Powered by Shutterstock logo - Get 15% off with code: PIKWIZARD15
Globe and stack with coins. Money makes the world go round - Powered by Shutterstock - Get 15% off with code: PIKWIZARD15Coins are laid out in graph.Business success concept wealth stock investment.Business in the digital age.Digital transformation for next generation technology.Technology is growing by leaps and bounds - Powered by Shutterstock - Get 15% off with code: PIKWIZARD15Stock funding or money saving graph with coins. Background for business ideas and design. Chart for financial investment concept - Powered by Shutterstock - Get 15% off with code: PIKWIZARD15Stock market or forex trading graph and candlestick chart suitable for financial investment concept. Economy trends background for business idea and all art work design. Abstract finance background - Powered by Shutterstock - Get 15% off with code: PIKWIZARD15gold coin stack isolated on white - Powered by Shutterstock - Get 15% off with code: PIKWIZARD15

Credit Photo

If you would like to credit the Photo, here are some ways you can do so

Free (free of charge)

Free for personal and commercial use.

Author: Creative Art

Similar Free Stock Images

Financial Data Displayed Over City Skyline with Rising Graphs
Premium
Gold coins stacks is representing riches and wealth management. Coin stack growing and find out the way to get a return on investment. Finance and money exchange investment as concept.
Global Economic Trends Highlighted on World Map with Graphs
Fluctuating Financial Graph with Red Line on Green Grid
Falling Line Graph on Navy Background Illustrating Economic Decline
Rising Digital Graph and Data Visualizations on Black Background
Premium
Business finance and investment, Analyze economic growth charts for informed business finance decisions and financial decision-making. Stock Market report, Strategy, Data Collection, Forecasting
Analyzing Accelerating Data Trends on Grid with Tech Insights
Dynamic Stock Market Data on Digital Interface
Data Trends and Analysis on 3D Digital Grid
Dynamic Financial Data Visualizations on Grid Interface
Premium
Double exposure of city and rows of coins for finance and banking concept
Futuristic Technology Interface with Digital Financial Graphs
Rising Financial Data Graph on Digital Grid Background
Data Visualization on Security Shield Interface for Cyber Security
Dynamic Stock Market Chart with Time Indicators and Data Trends
Premium
Piggy bank gold color and stack of money safe in the garden outside.
Dynamic Financial Graphs Overlaying Modern Cityscape
Dynamic Red Line Graph Over Green Grid Background
Fluctuating Financial Graph on Green Grid Background
Financial Stock Market Data Visualization with Declining Trends
Premium
Businessman putting down money, pointing with pen and showing candlestick symbol for investing, finance, saving money, interest rate or dividend investment, business growth concept.
Advanced Financial Charting with Zigzag Indicator and Trends
Futuristic 3D Data Visualization with Glowing Bars
Dynamic Financial Chart on Digital Dashboard
Futuristic Energy Tracking with Rocket Blueprint and Data Analytics
Premium
Finance and money technology background concept of business prosperity and asset management . Creative graphic show economy and financial growth by investment in valuable asset to gain wealth profit .
Digital Financial Analytics with Red Trends on Grid Screen
Futuristic HUD Facial Recognition Avatar with Neon Waveform Analytics and Grid Interface
Candlestick trading chart displaying trend lines, indicators and percentage labels
Glowing Neon Red Global Trend Line Chart Showing Market Fluctuations on Digital World Map
Futuristic Stock Market Data with Mathematical Formulas
Financial Data Overlay on Cityscape Visualizing Market Trends
Premium
gold money coin background are laid in graph.Business success concept wealth stock investment.Business in the digital age.Digital transformation for next generation technology.  concept saving money
Dynamic Financial Graph Over Red Background
Rising Financial Market Trends with Data Visualization
Financial Stock Market Data Analysis on Digital Interface
High-Tech Transportation Van with Digital Interface
Premium
Investments in gold. Investor hand draws financial chart. Gold bars near quotes. Trading on precious metals market. Golden futures. Investment in gold mining company. Golden metal price forecast.
Financial Graph Analysis on Green Grid Background
Dynamic Financial Charts and Graphs Indicating Market Trends
Dynamic Financial Data Chart Display with Graphical Analysis
Financial Data Analysis in Digital Interface with Graphs
Premium
stack of silver coins with trading chart in financial concepts and financial investment business stock growth
Dynamic Financial Data Visualization on Digital Grid Background
Cybersecurity Concept with Declining Data Graph and Digital Shield
Dynamic Financial Graphs and Data Analysis Interface
NFT Financial Data Visualization with Digital Graph Overlay
Premium
Gold bar lean against the stacking coins on  USD bills . Gold is hard commodity goods, risk asset, tangible value that used to be gold reserve, save assets during war and economic crisis
Global Financial Data Analysis with Colorful Graphs
Abstract Financial Data Processing and Analysis Interface
Dynamic Financial Data Displays Stock Market Trends
Digital Stock Market Graph Red Trendline on Green Background
Premium
gold bar concept
Futuristic Candlestick Chart with Blueprint Grid
Futuristic 3D Finance Dashboard with Neon Waveform and Candlesticks
Dynamic Financial Graph with Candlestick Patterns and Percentage Metrics
Interactive Line Graph Dashboard with Coding Background
Premium
investment and finance concept, businessman holding virtual trading graph and blurred coins on hand, stock market, profits and business growth.
Dotted DNA helix weaving through biotech analytics dashboard with colorful data graphs
Tracking neon-cyan analytics dashboard showing social engagement peaks with 5760 likes tooltip
Neon Green Data Trend Line Displaying Node Markers on Dark Grid with Waveform Overlays and BI
Line Graphs on Digital Background Show Financial Data Trends
Digital Financial Data Overlaying City Skyline at Dusk
Financial Data Graph Rendering Global Market Trends
Premium
stacks of gold money coin background concept saving money
Dynamic Green Stock Chart on Digital Grid Background
Data Analytics and Financial Growth Indicators
Digital Finance: Modern Stock Market Analysis Display
Financial Data Line Graph on Digital Display
Premium
A pile of Coins on a white background
Dynamic Financial Growth Digital Chart Display
Financial Graphs Displaying Business Trends on Grid Background
Futuristic Global Finance Chart with Rotating Globe Animation
Rising Graph Line on Digital Green Grid Background
Premium
Two hands giving stacks of silver coins with 2024 trading chart, financial concept and stock growth, financial investment business with up arrow and percentage symbol Finance increases interest rates
Digital Financial Data and AI Illustration Networking Globally
Data Analysis Graphics on Digital Grid Background
Dynamic Financial Chart with Upward Growth Arrow
Dynamic Financial Graphs Overlaying Urban Skyline
Premium
Human hand stacking coins over a black background with hexagonal golden shapes. Concept of investment management and portfolio diversification. Composite image between a hand photography and a 3D back
Abstract Digital Data Graph and Diagrams on Gray Background
Dynamic Stock Market Chart with Fluctuating Trends and Data Points
Futuristic Digital DNA Strand with Data Connectivity
Red Zigzag Graph with Arrow on Green Grid Background
Premium
Stack of Gold Coin  with Arrow visual graphic and candle stick graph. Fussiness Concept : Market uptrend. COPY SPACE.
Green Fluctuating Line Graph on Digital Grid for Financial Analysis
Fluctuating Line Chart on Analytics Dashboard Interface
Financial Data Visualization with Colorful Graphs and Charts Representing Analytics
Futuristic Financial Data Chart with Teal Grid Elements and Code Snippets
Premium
Coins, cryptocurrency and online trading statistics, value and international commerce for finance. Mining, virtual money and market graphs for investment, research and overlay for global exchange
Neon Social Media Analytics Line Chart with Engagement Bubbles Showing Likes Comments
Multiseries Financial Market Chart Showing Rising Green Trend Candlesticks and Percent Labels
Graph Lines Portraying Financial Data Trends
World Map with Falling Line Graphs Indicating Global Economic Decline
Financial Data Flow against Urban Skyline Backdrop
Dynamic Line Chart with Histogram on Digital Grid Background
Premium
Double exposure of graph and rows of coins for finance and business concept
Digital Rendering Concept of Van with Soundwave and Data Grid Overlay
Fluctuating Digital Stock Market Data Chart
Digital Financial Data with Graph and Grid Patterns
Futuristic Graph with Digital Globe Symbolizing Global Technology Connections
Premium
Bitcoin Cryptocurrency coins chart trending price up trend digital financial cash money market trending price concept, futuristic virtual digital graph chart price, 3D illustration banner background
Digital Data Visualization with Trend Lines and Percentage Changes
Colorful Data Visualization on Dark Background
Financial Graphs with Social Media Analytics on Digital Chart
Abstract Digital Charts with Social Media Metrics Rising
Premium
Save money for investment concept. Stack of coins with trading chart in financial, stock market, wealth economy, interest rate, Inflation and tax. Saving money, long term investment
Financial Data Analysis Vibrant Graphs on Blue Background
Analyzing Financial Data on Digital World Map Background
Cityscape with Digital Stock Market Graphs and Statistics
Dynamic Financial Data Overlaid on Grid Background
Premium
gold coin stack isolated on white
Fluctuating Stock Market Graph with Dramatic Peaks
Global Analytics Dashboard with Zigzag Chart on Dark Interface
Fluctuating Line Graphs on Blue Grid with City Skyline
Digital Finance Dashboard Showing Candlestick and Line Charts
Premium
Business finance and investment, Analyze economic growth charts for informed business finance decisions and financial decision-making. Stock Market report, Strategy, Data Collection, Forecasting
Neon DNA Strand Overlapping Financial Data Analytics
Green Line Chart on Dark Grid Interface with Sine Wave Data
Red Downtrend Line Falling Across Digital Financial Dashboard With Teal Indicator Dots
Realtime Trading Dashboard Showing Green Candlestick Chart with Technical Indicators and Volume
Premium
Red up arrow and stacks of gold coins isolated on white background.
Neon Red Market Trend Line with Social Media Engagement Callouts on Green Data Grid