
- Home >
- Stock Photos >
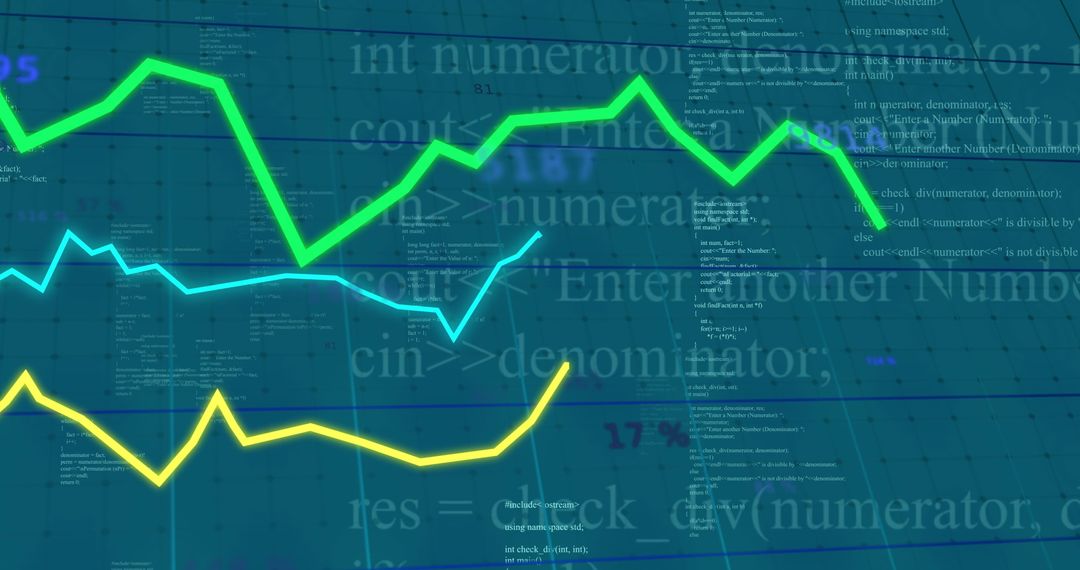
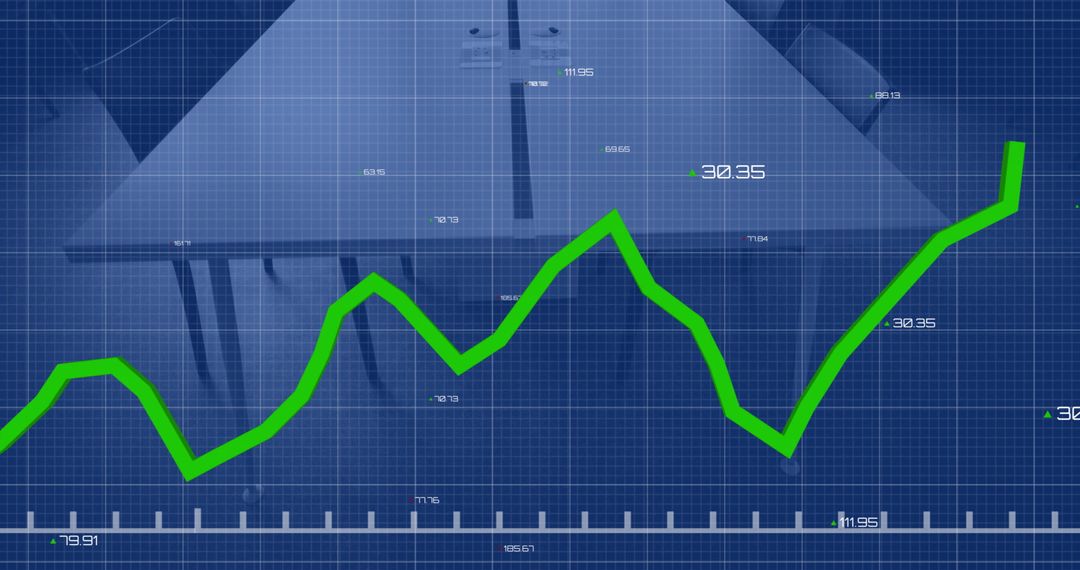
- Graph Overlay with Chemical Experiment Representation
Graph Overlay with Chemical Experiment Representation Image

Image shows green line graph overlaid on laboratory scene, highlighting chemical reaction. Ideal for illustrating topics related to data analysis, financial trends, scientific research backgrounds. Useful for presentations on business growth or educational material.
Powered by  - Get 15% off with code: PIKWIZARD15


2
downloads
downloads
Tags:
More
Credit Photo
If you would like to credit the Photo, here are some ways you can do so
Text Link
photo Link
<span class="text-link">
<span>
<a target="_blank" href=https://pikwizard.com/photo/graph-overlay-with-chemical-experiment-representation/4f2882e37433ad37d33f27d7675eb0a9/>PikWizard</a>
</span>
</span>
<span class="image-link">
<span
style="margin: 0 0 20px 0; display: inline-block; vertical-align: middle; width: 100%;"
>
<a
target="_blank"
href="https://pikwizard.com/photo/graph-overlay-with-chemical-experiment-representation/4f2882e37433ad37d33f27d7675eb0a9/"
style="text-decoration: none; font-size: 10px; margin: 0;"
>
<img src="https://pikwizard.com/pw/medium/4f2882e37433ad37d33f27d7675eb0a9.jpg" style="margin: 0; width: 100%;" alt="" />
<p style="font-size: 12px; margin: 0;">PikWizard</p>
</a>
</span>
</span>
Free (free of charge)
Free for personal and commercial use.
Author: Creative Art
Similar Free Stock Images

Premium


Premium


Premium


Premium


Premium


Premium


Premium


Premium


Premium


Premium


Premium


Premium


Premium


Premium


Premium


Premium


Premium


Premium


Premium


Premium


Premium


Premium


Premium


Premium

