
- Home >
- Stock Photos >
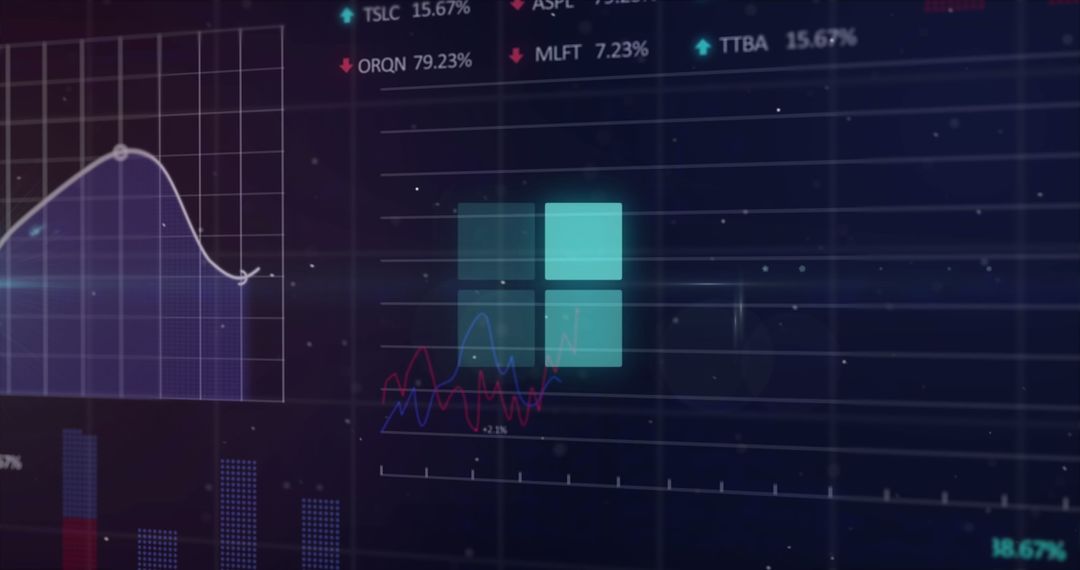
- Graphical Display of Stock Market Trends with Gradient Background
Graphical Display of Stock Market Trends with Gradient Background Image

Visualization ideal for financial reports, investment blogs, or educational presentations. Highlights stock trends, useful for illustrating market analysis in finance-themed contexts. Rich gradient colors add modern, professional touch to data display.
Powered by 


2
downloads
downloads
Tags:
More
Credit Photo
If you would like to credit the Photo, here are some ways you can do so
Text Link
photo Link
<span class="text-link">
<span>
<a target="_blank" href=https://pikwizard.com/photo/graphical-display-of-stock-market-trends-with-gradient-background/989f436841ca26937d2b489fcc4996d3/>PikWizard</a>
</span>
</span>
<span class="image-link">
<span
style="margin: 0 0 20px 0; display: inline-block; vertical-align: middle; width: 100%;"
>
<a
target="_blank"
href="https://pikwizard.com/photo/graphical-display-of-stock-market-trends-with-gradient-background/989f436841ca26937d2b489fcc4996d3/"
style="text-decoration: none; font-size: 10px; margin: 0;"
>
<img src="https://pikwizard.com/pw/medium/989f436841ca26937d2b489fcc4996d3.jpg" style="margin: 0; width: 100%;" alt="" />
<p style="font-size: 12px; margin: 0;">PikWizard</p>
</a>
</span>
</span>
Free (free of charge)
Free for personal and commercial use.
Author: Authentic Images
Similar Free Stock Images

Premium


Premium


Premium


Premium


Premium


Premium


Premium


Premium


Premium


Premium


Premium


Premium


Premium


Premium


Premium


Premium


Premium


Premium


Premium


Premium


Premium


Premium


Premium


Premium

