- Home >
- Stock Photos >
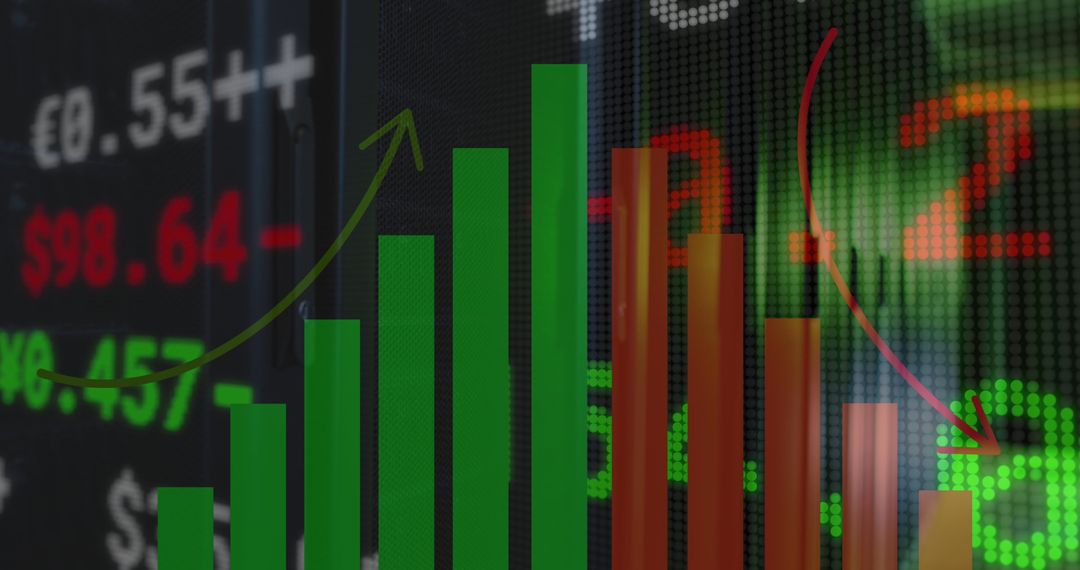
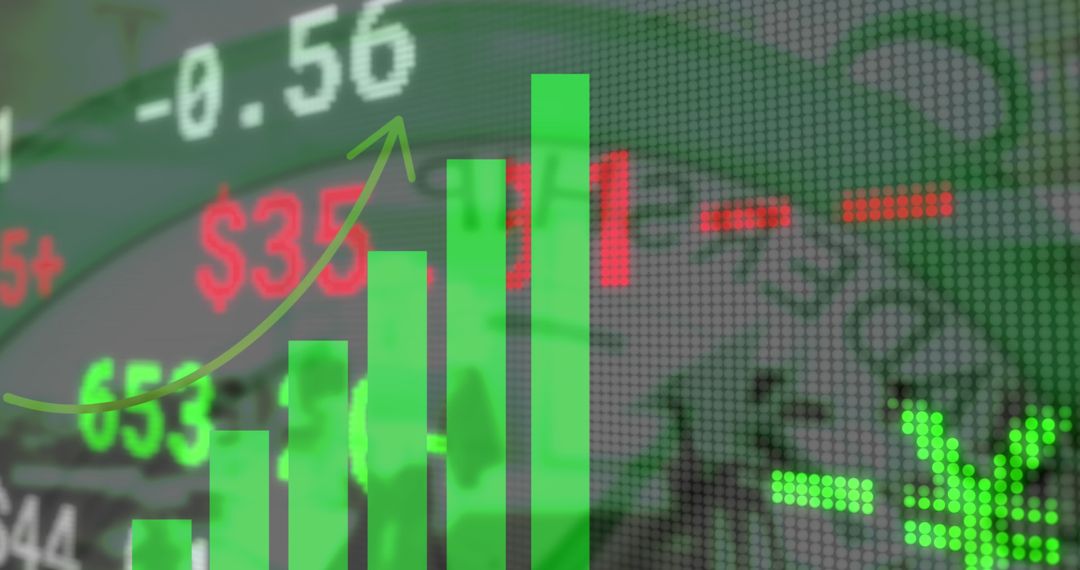
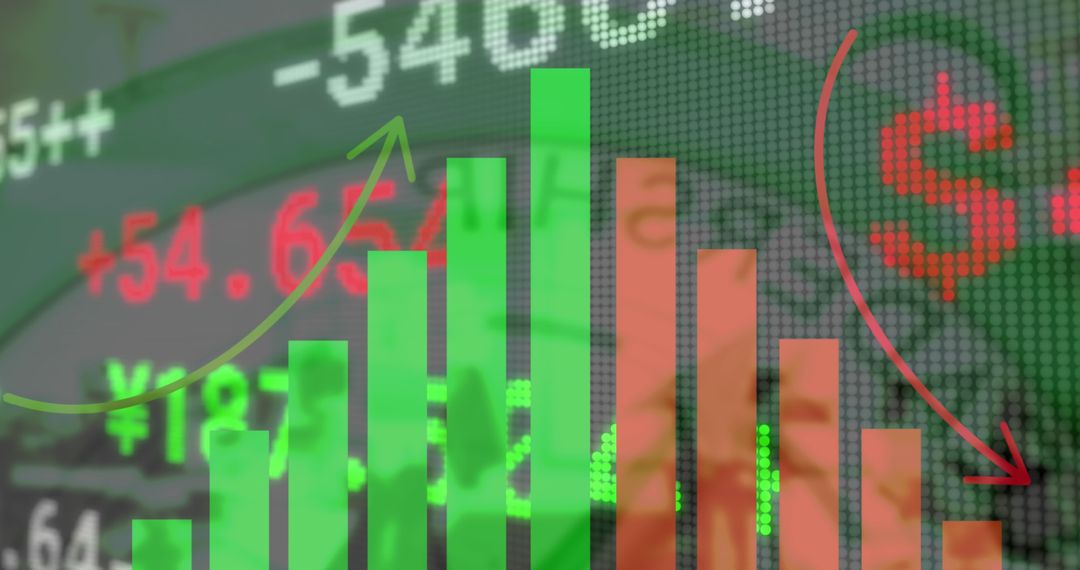
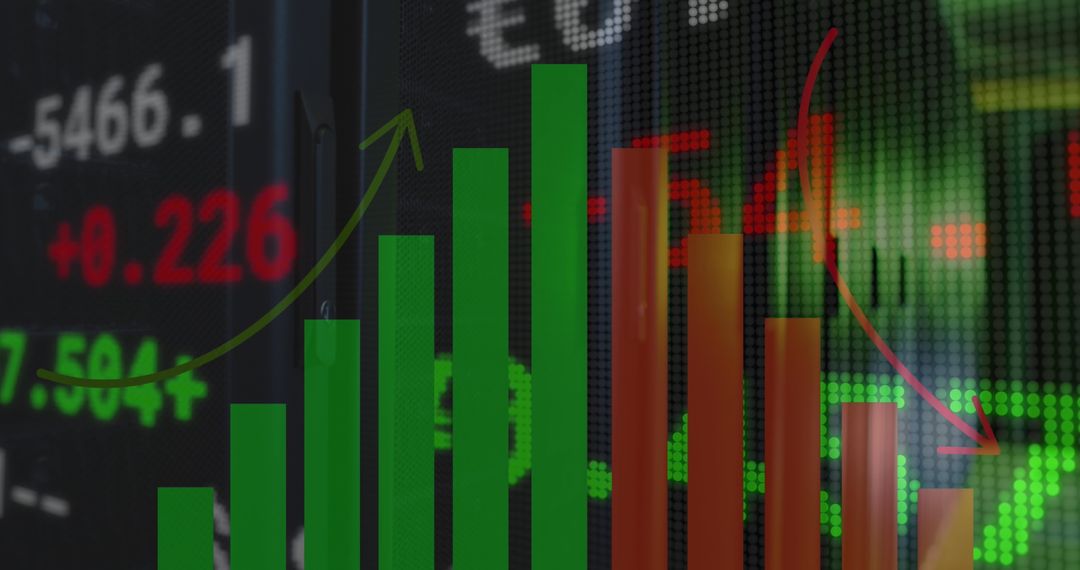
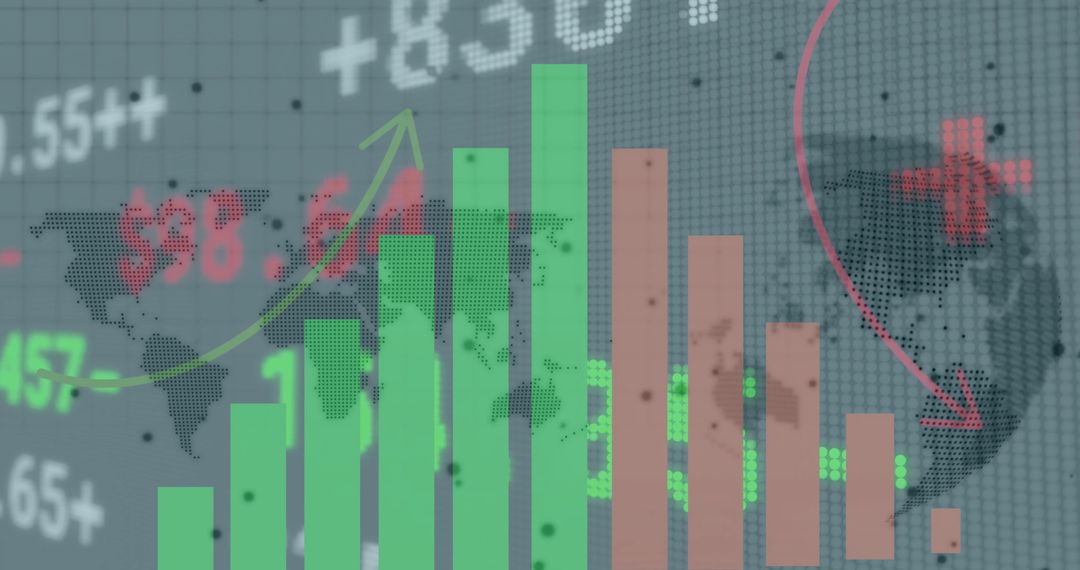
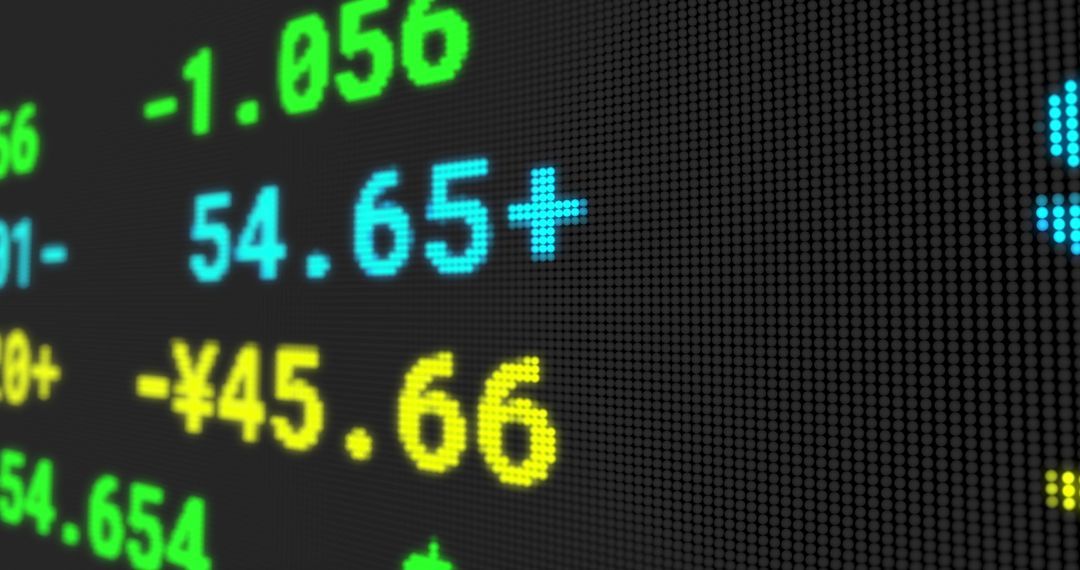
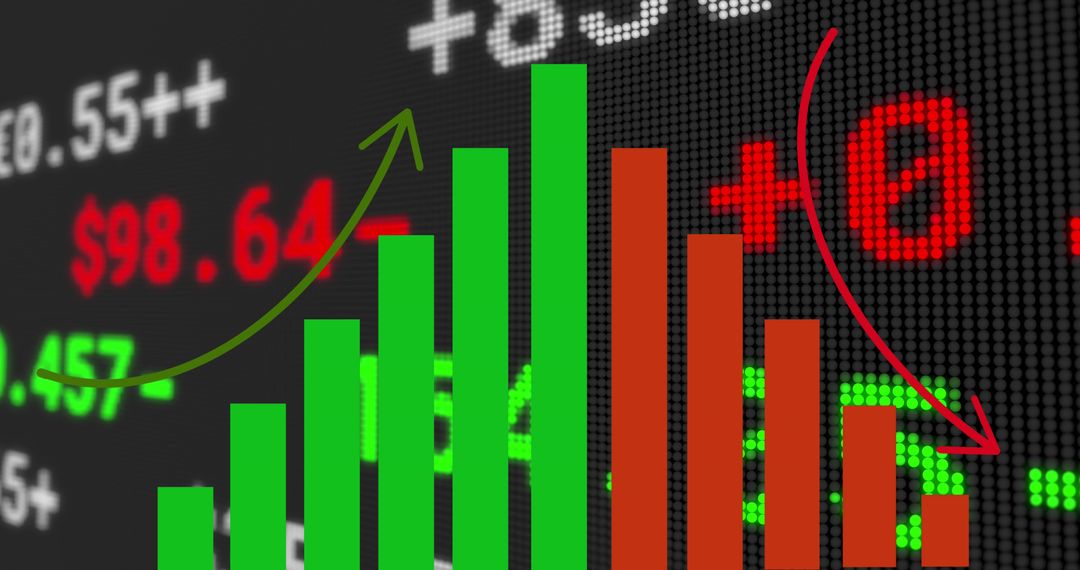
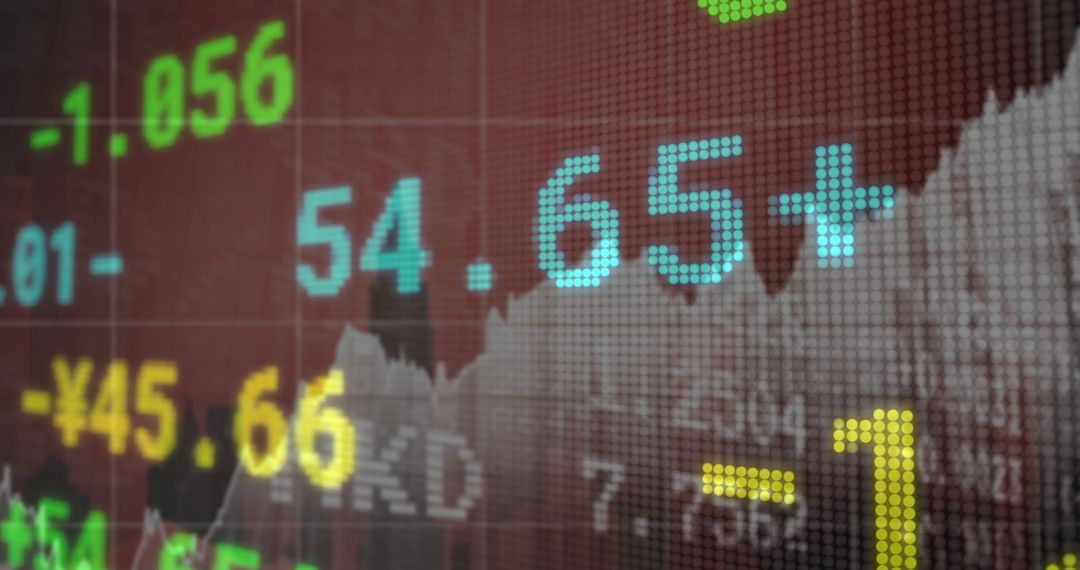
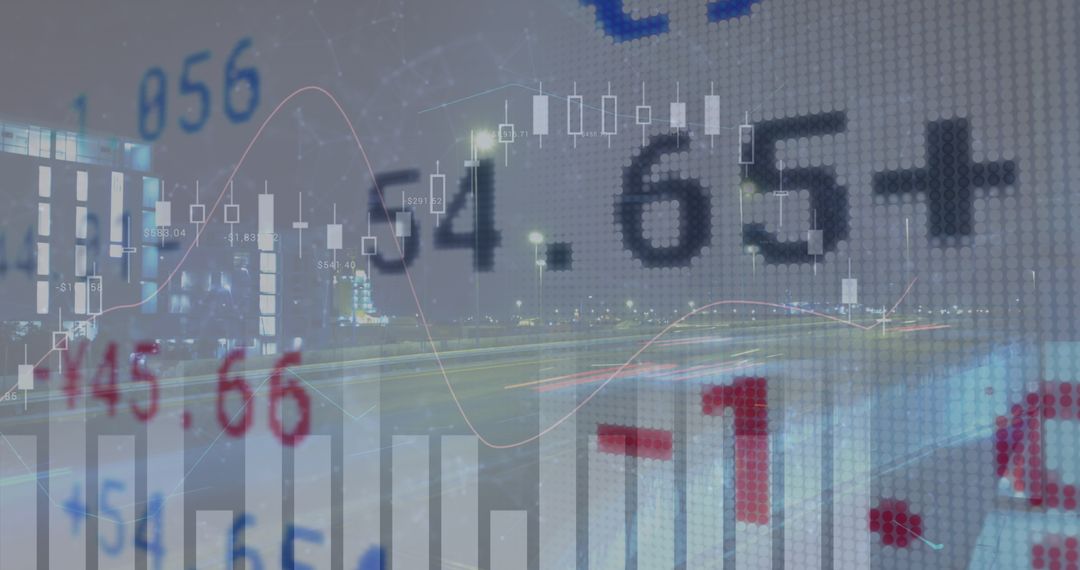
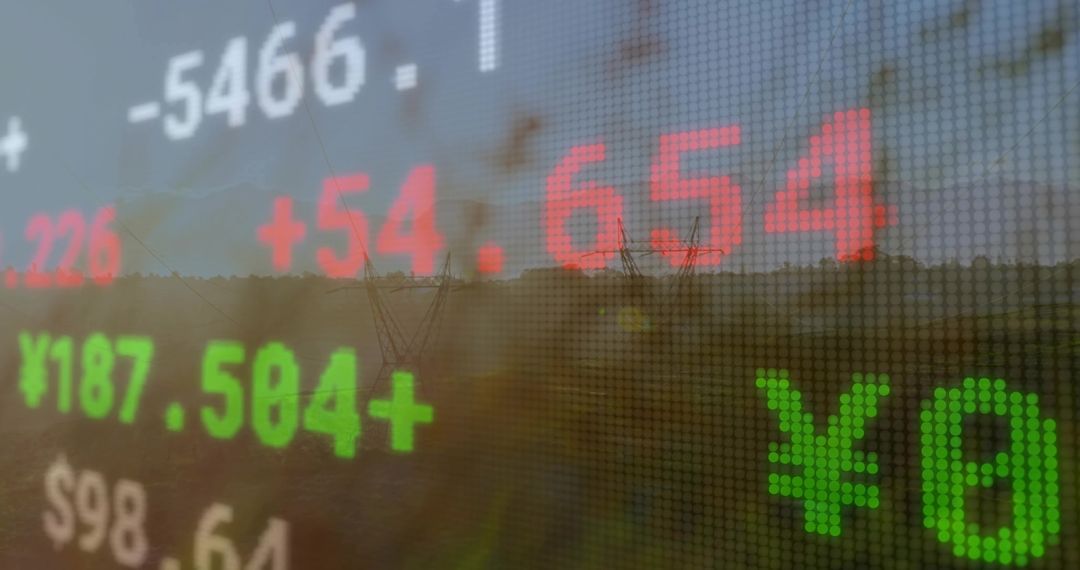
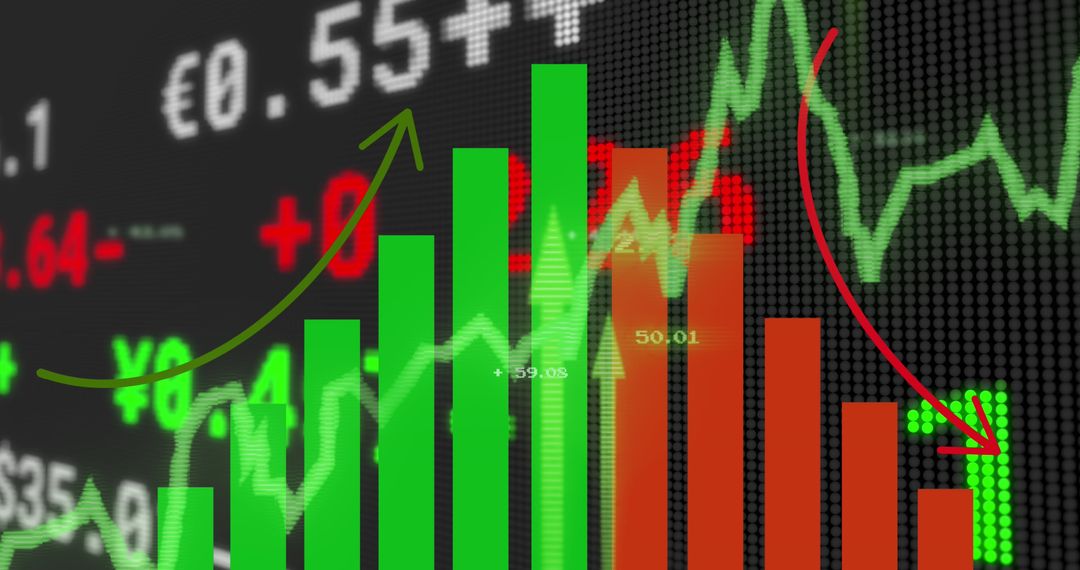
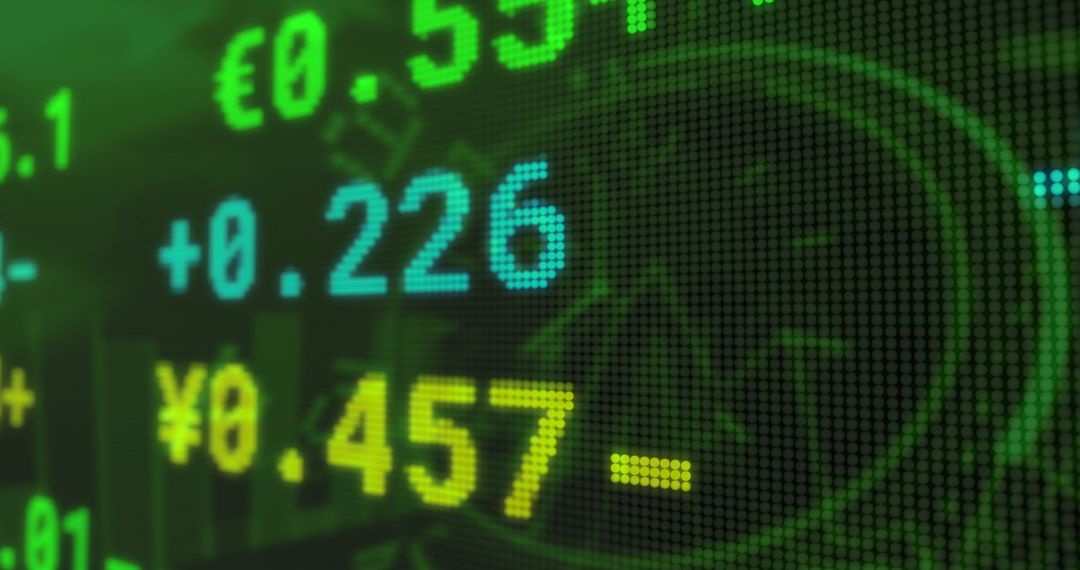
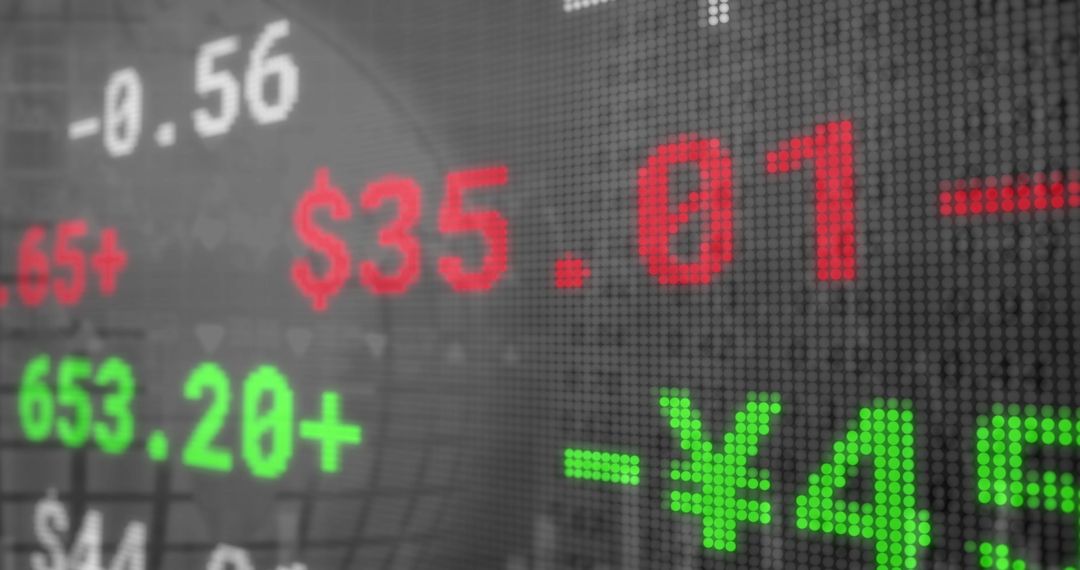
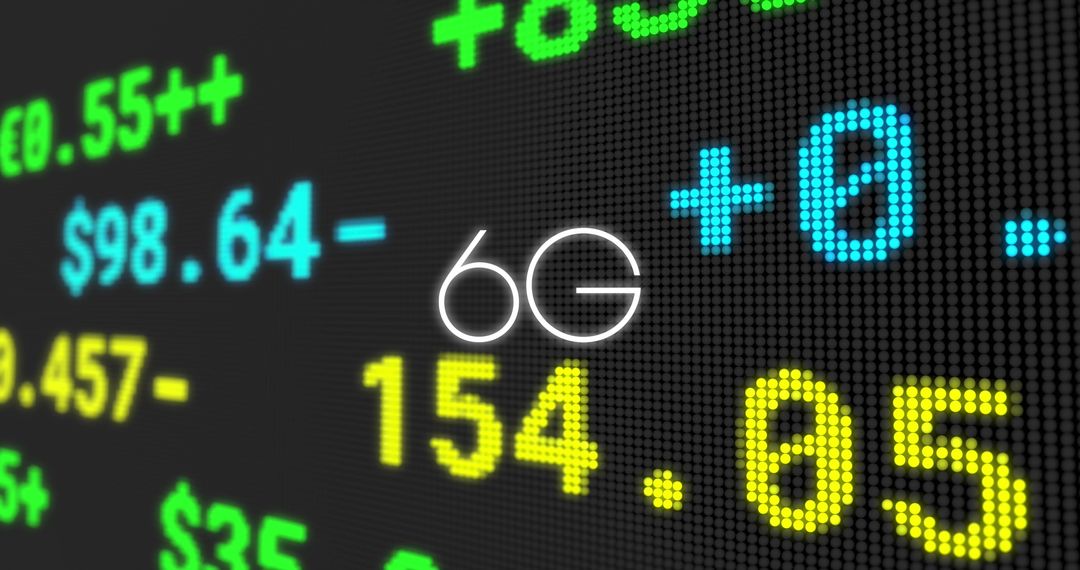
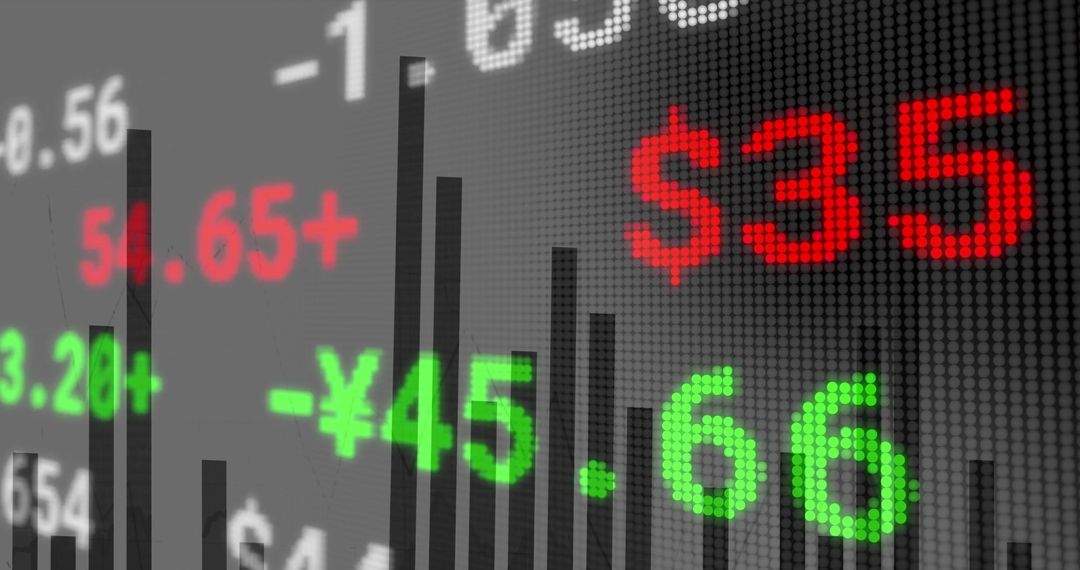
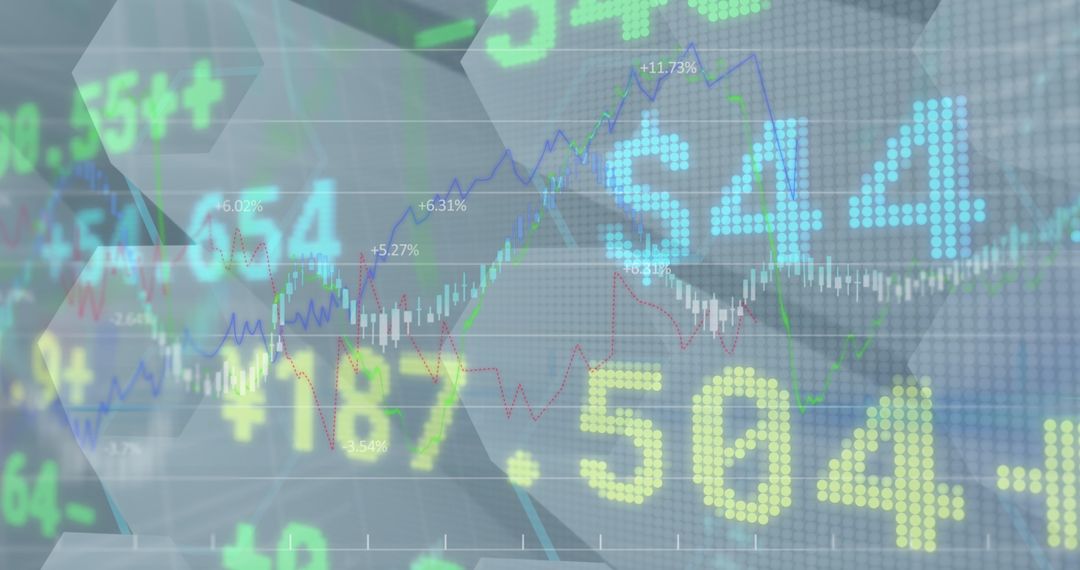
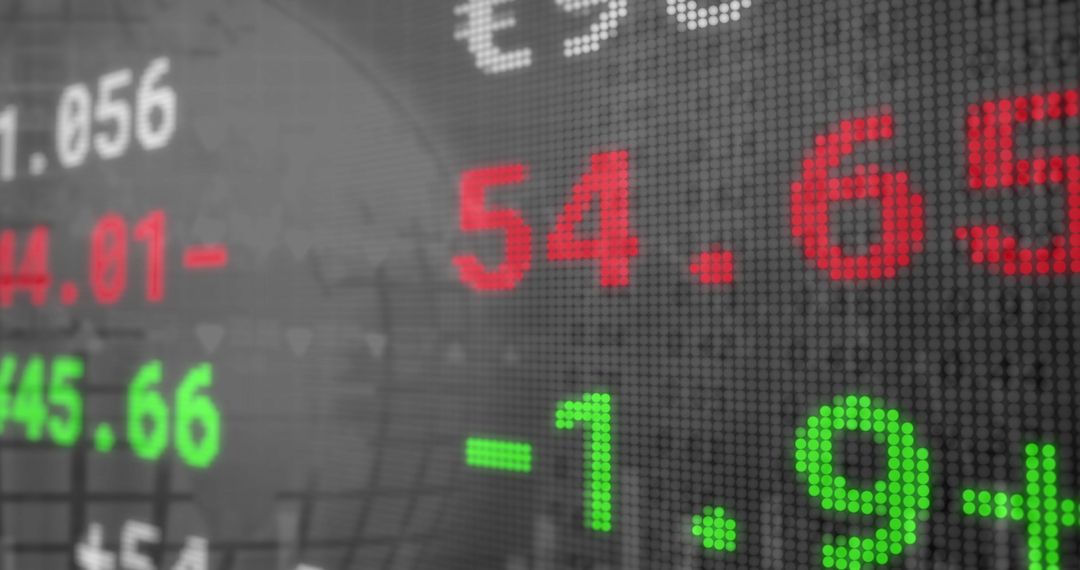
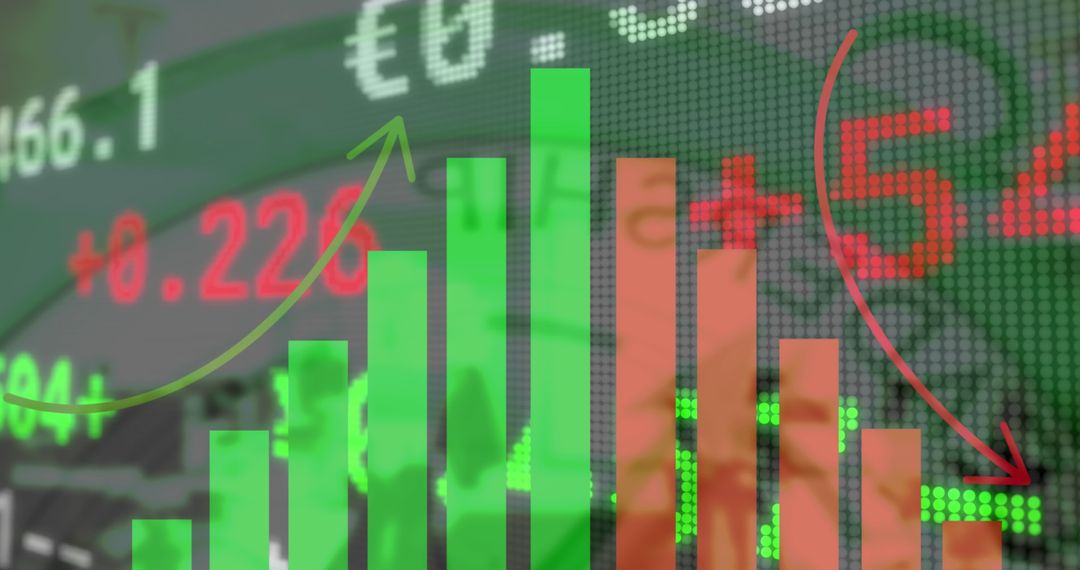
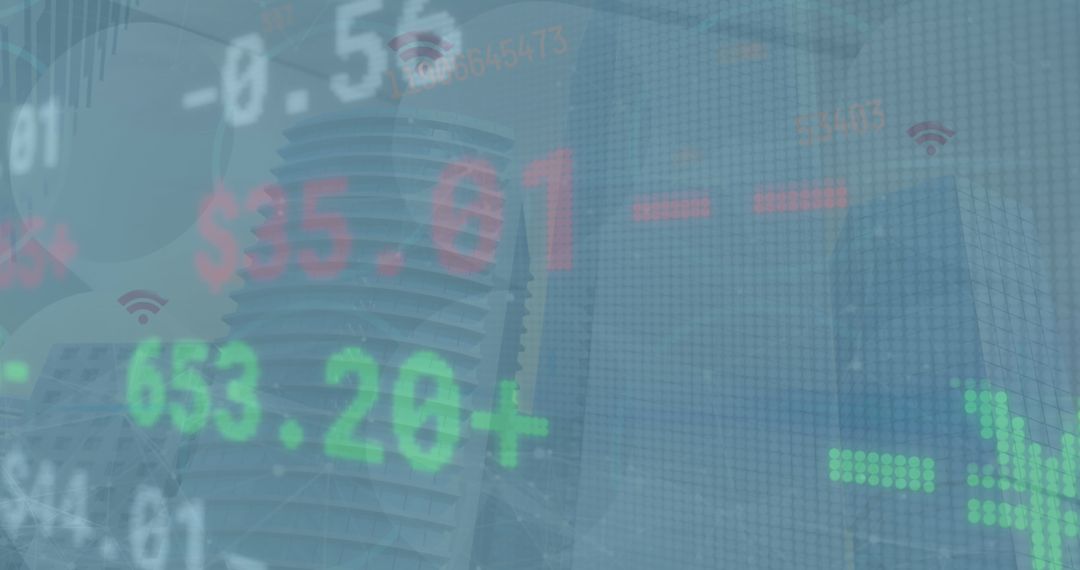
- Green and Red Bar Graph Overlaying Stock Market Data
Green and Red Bar Graph Overlaying Stock Market Data Image
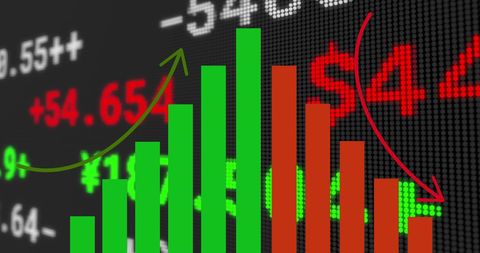
This digital concept showcases vibrant green and red bar graphs depicted over stock market tickers, indicating financial trends. The image presents a sense of economic fluctuation, showcasing growth and decline. Ideal for use in presentations, financial reporting, or articles discussing stock market behavior and investment strategies. Effective for conveying economic insights and demonstrating statistical analyses for educational purposes.
Powered by  - Get 15% off with code: PIKWIZARD15


2
downloads
downloads
Tags:
More
Credit Photo
If you would like to credit the Photo, here are some ways you can do so
Text Link
photo Link
<span class="text-link">
<span>
<a target="_blank" href=https://pikwizard.com/photo/green-and-red-bar-graph-overlaying-stock-market-data/1a879250c3986e32c0b9c4eb0537850a/>PikWizard</a>
</span>
</span>
<span class="image-link">
<span
style="margin: 0 0 20px 0; display: inline-block; vertical-align: middle; width: 100%;"
>
<a
target="_blank"
href="https://pikwizard.com/photo/green-and-red-bar-graph-overlaying-stock-market-data/1a879250c3986e32c0b9c4eb0537850a/"
style="text-decoration: none; font-size: 10px; margin: 0;"
>
<img src="https://pikwizard.com/pw/medium/1a879250c3986e32c0b9c4eb0537850a.jpg" style="margin: 0; width: 100%;" alt="" />
<p style="font-size: 12px; margin: 0;">PikWizard</p>
</a>
</span>
</span>
Free (free of charge)
Free for personal and commercial use.
Author: People Creations
Similar Free Stock Images
Premium


Premium


Premium


Premium


Premium


Premium


Premium

Premium


Premium

Premium

Premium


Premium


Premium


Premium


Premium


Premium

Premium


Premium


Premium

Premium


Premium


Premium


Premium


Premium