- Home >
- Stock Photos >
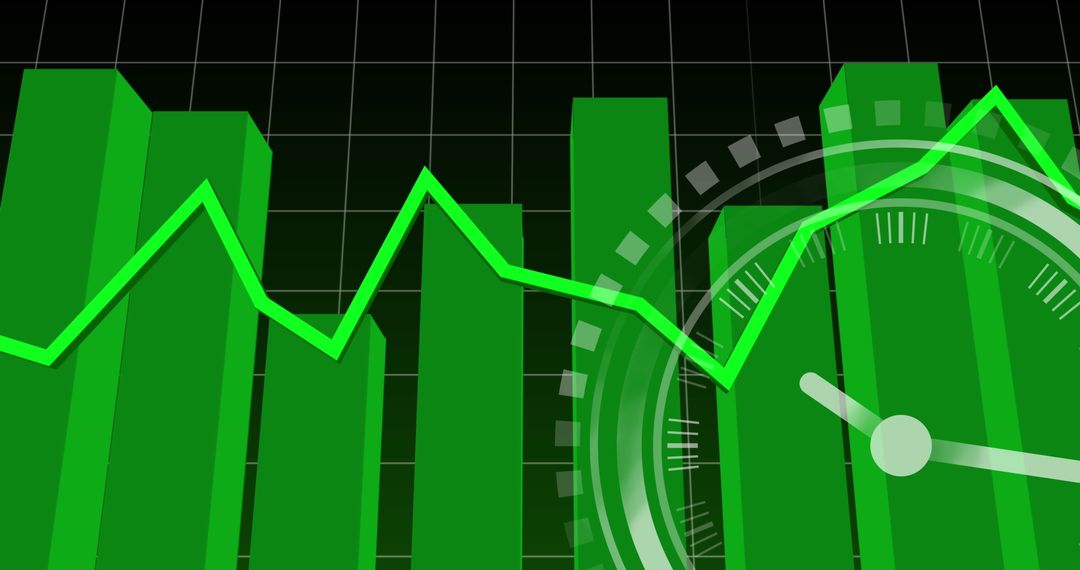
- Green Bar and Line Chart on Black Grid Representing Financial Data
Green Bar and Line Chart on Black Grid Representing Financial Data Image

Digital chart displaying financial data with green bars and line graph on a black grid. Useful for marketing materials related to finance, business strategy, investment analysis, and data visualization tools. Ideal for illustrating concepts of market trends, economic forecasting, and growth potential in presentations and reports.
Powered by 


2
downloads
downloads
Tags:
More
Credit Photo
If you would like to credit the Photo, here are some ways you can do so
Text Link
photo Link
<span class="text-link">
<span>
<a target="_blank" href=https://pikwizard.com/photo/green-bar-and-line-chart-on-black-grid-representing-financial-data/0ea2f6e787c88a6547c3c39b4c000ba7/>PikWizard</a>
</span>
</span>
<span class="image-link">
<span
style="margin: 0 0 20px 0; display: inline-block; vertical-align: middle; width: 100%;"
>
<a
target="_blank"
href="https://pikwizard.com/photo/green-bar-and-line-chart-on-black-grid-representing-financial-data/0ea2f6e787c88a6547c3c39b4c000ba7/"
style="text-decoration: none; font-size: 10px; margin: 0;"
>
<img src="https://pikwizard.com/pw/medium/0ea2f6e787c88a6547c3c39b4c000ba7.jpg" style="margin: 0; width: 100%;" alt="" />
<p style="font-size: 12px; margin: 0;">PikWizard</p>
</a>
</span>
</span>
Free (free of charge)
Free for personal and commercial use.
Author: Creative Art
Similar Free Stock Images

Premium


Premium


Premium


Premium


Premium


Premium


Premium


Premium


Premium


Premium


Premium


Premium


Premium


Premium


Premium


Premium


Premium


Premium


Premium


Premium


Premium


Premium


Premium


Premium