- Home >
- Stock Photos >
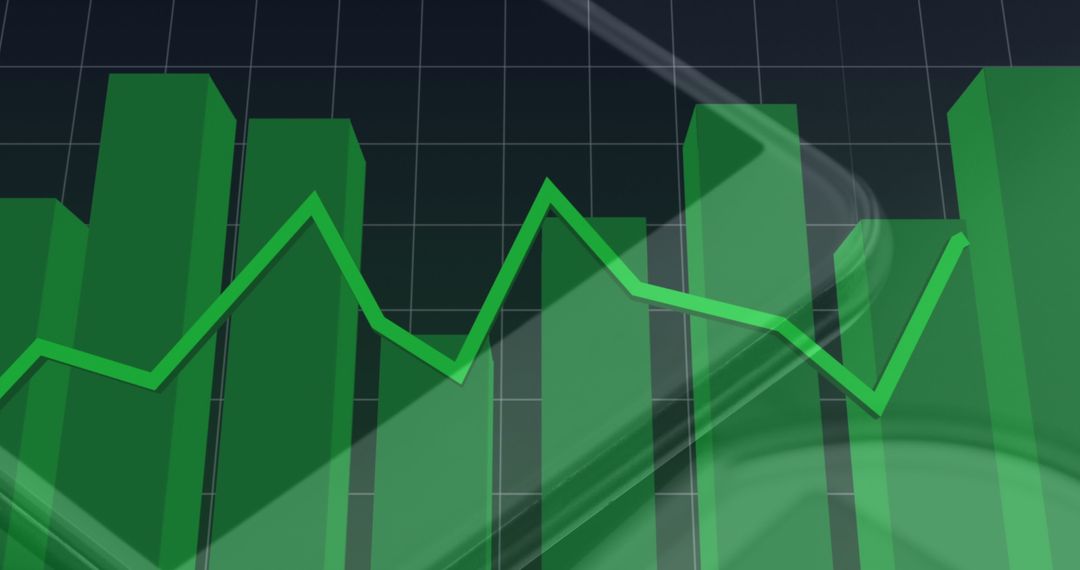
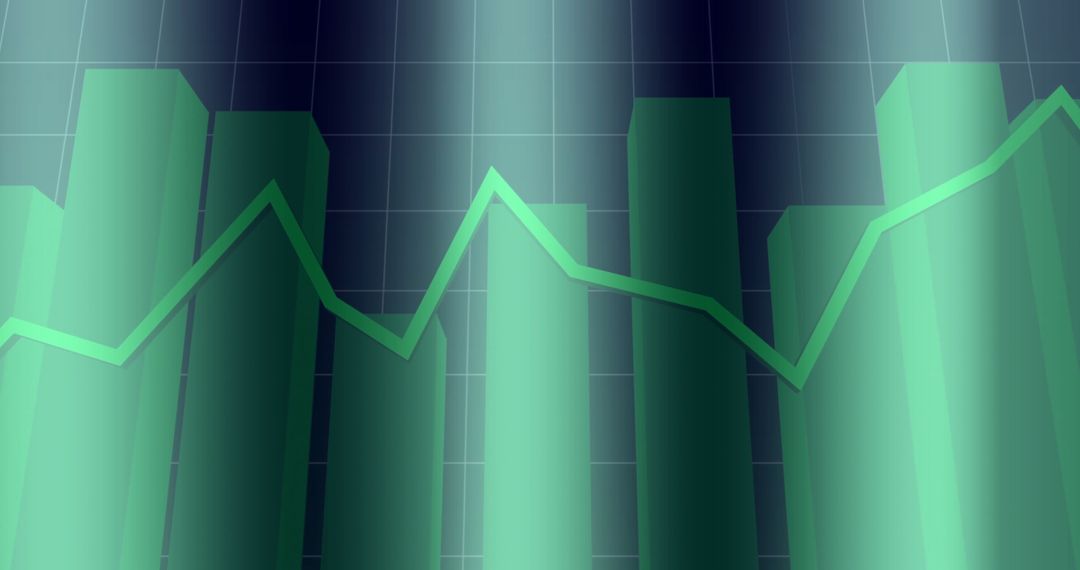
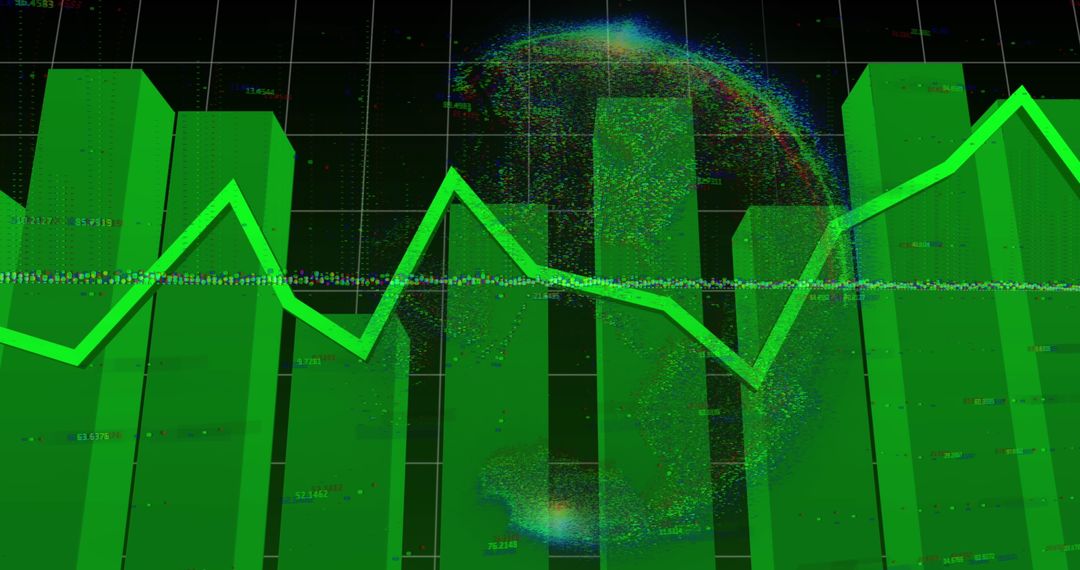
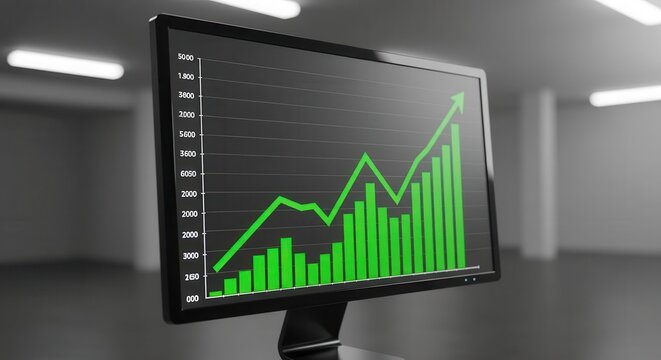
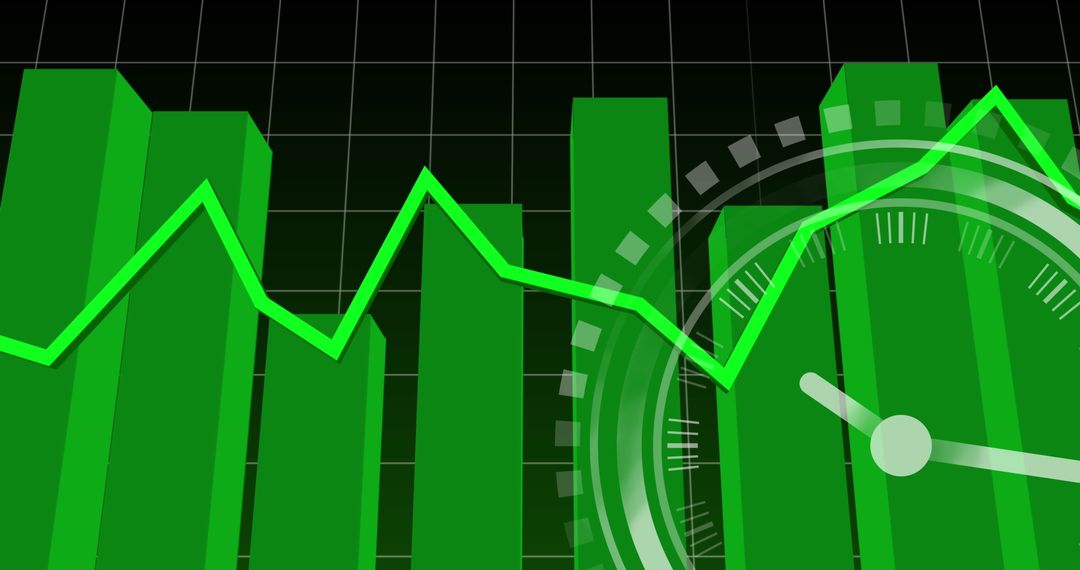
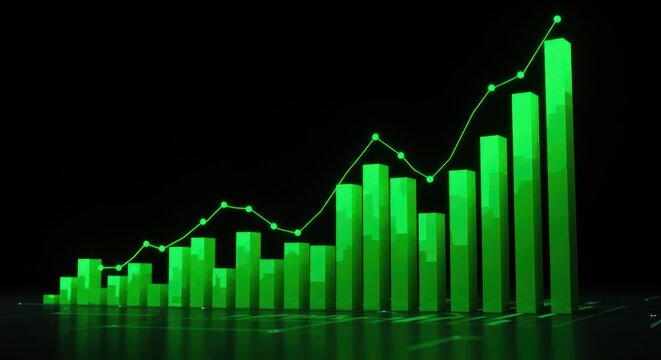
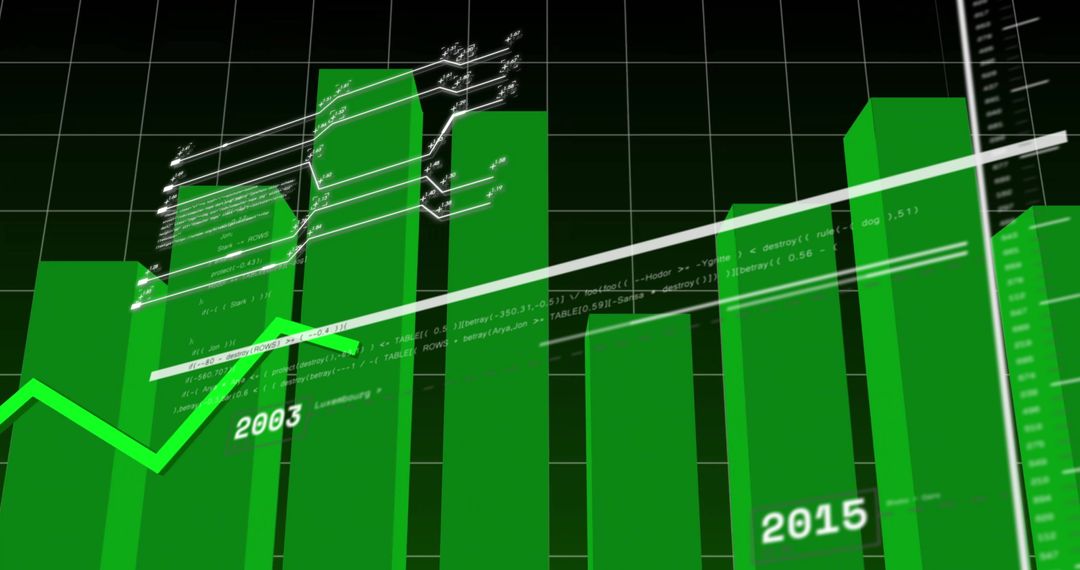
- Green Bar and Line Graph on Dark Interface
Green Bar and Line Graph on Dark Interface Image

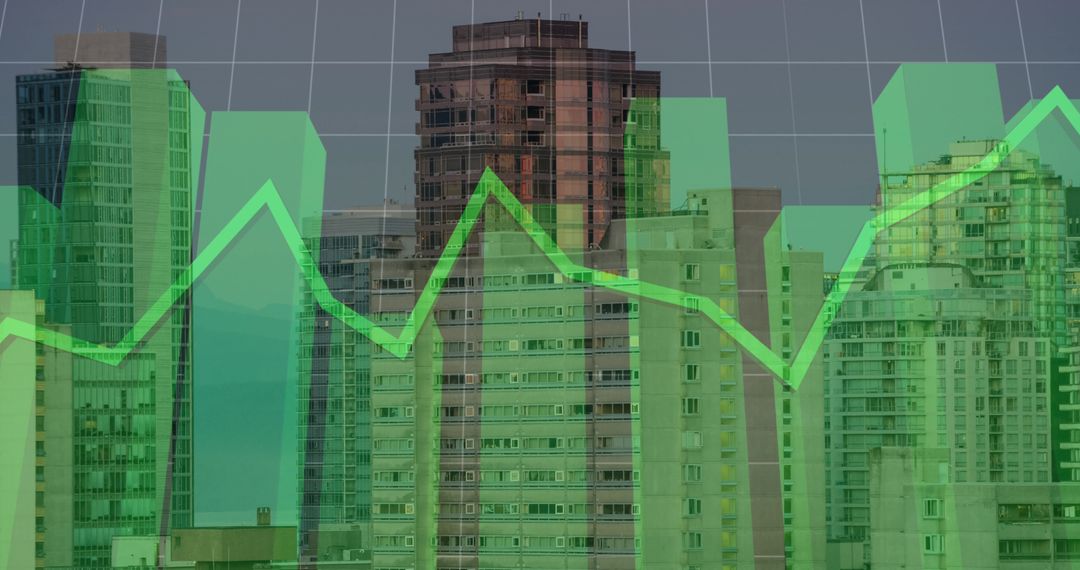
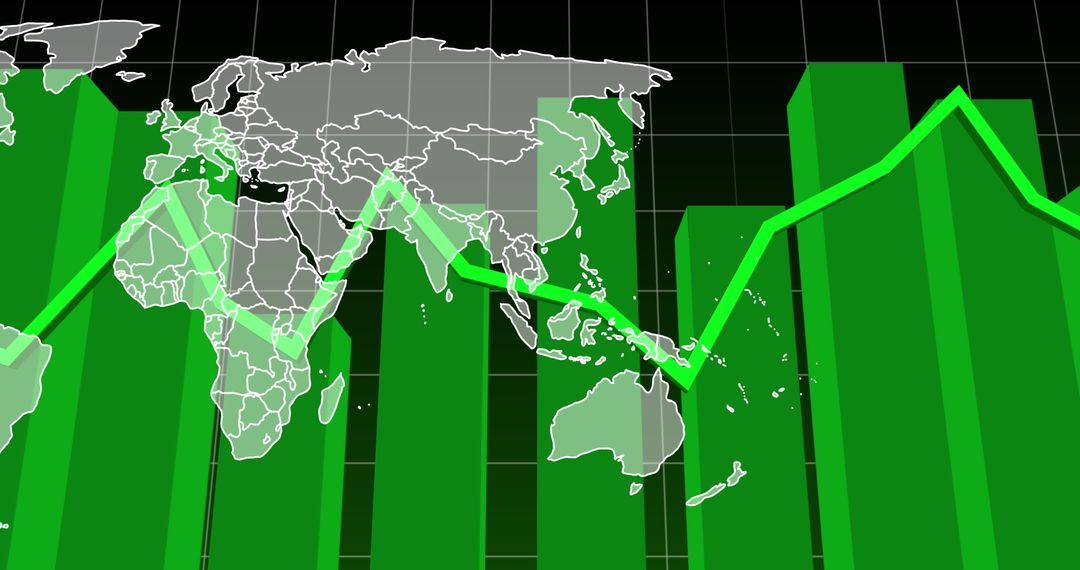
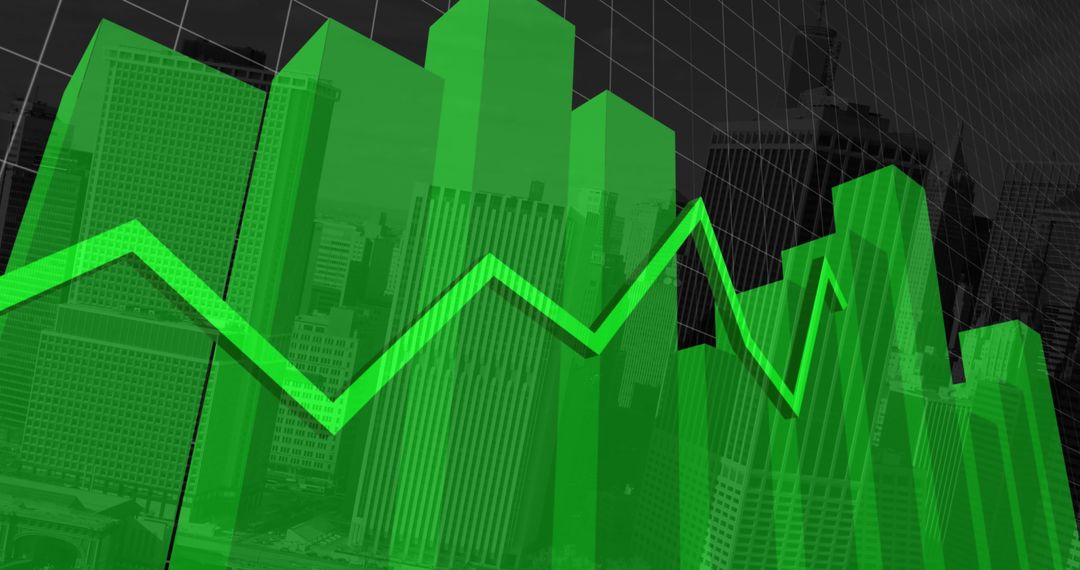
Concept of data analysis and business trends using green line and bar graphs on a dark background makes it ideal for illustrating financial statistics, market trends, or business reports. Useful for presentations, dashboards, or articles focused on data visualization techniques.
Powered by 


2
downloads
downloads
Tags:
More
Credit Photo
If you would like to credit the Photo, here are some ways you can do so
Text Link
photo Link
<span class="text-link">
<span>
<a target="_blank" href=https://pikwizard.com/photo/green-bar-and-line-graph-on-dark-interface/ba6b0085e87187616654c1cac2d71b45/>PikWizard</a>
</span>
</span>
<span class="image-link">
<span
style="margin: 0 0 20px 0; display: inline-block; vertical-align: middle; width: 100%;"
>
<a
target="_blank"
href="https://pikwizard.com/photo/green-bar-and-line-graph-on-dark-interface/ba6b0085e87187616654c1cac2d71b45/"
style="text-decoration: none; font-size: 10px; margin: 0;"
>
<img src="https://pikwizard.com/pw/medium/ba6b0085e87187616654c1cac2d71b45.jpg" style="margin: 0; width: 100%;" alt="" />
<p style="font-size: 12px; margin: 0;">PikWizard</p>
</a>
</span>
</span>
Free (free of charge)
Free for personal and commercial use.
Author: Awesome Content
Similar Free Stock Images

Premium


Premium


Premium


Premium


Premium


Premium


Premium


Premium


Premium


Premium


Premium


Premium


Premium


Premium


Premium


Premium


Premium


Premium


Premium


Premium


Premium


Premium


Premium


Premium