- Home >
- Stock Photos >
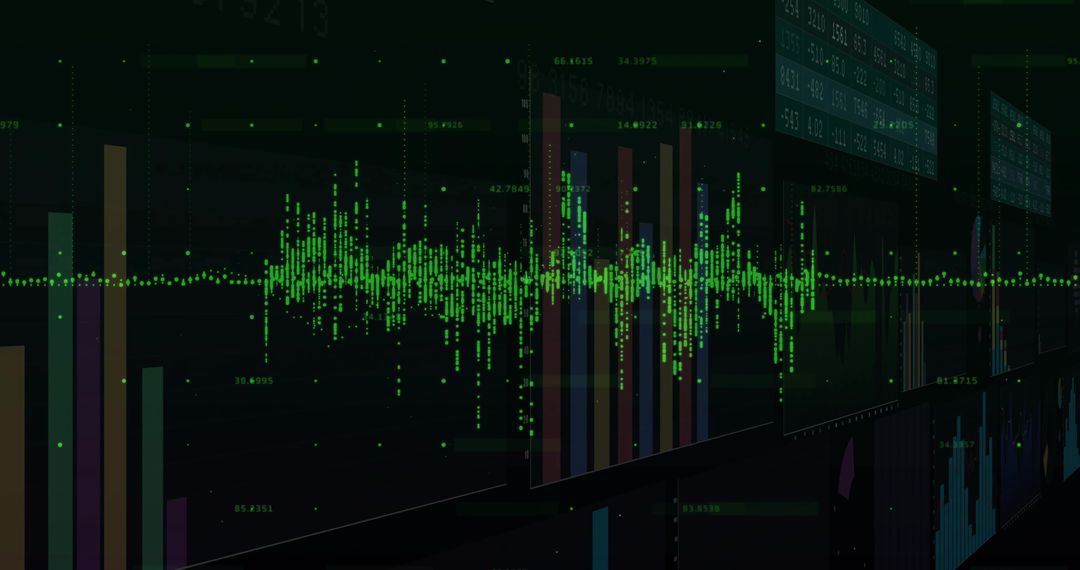
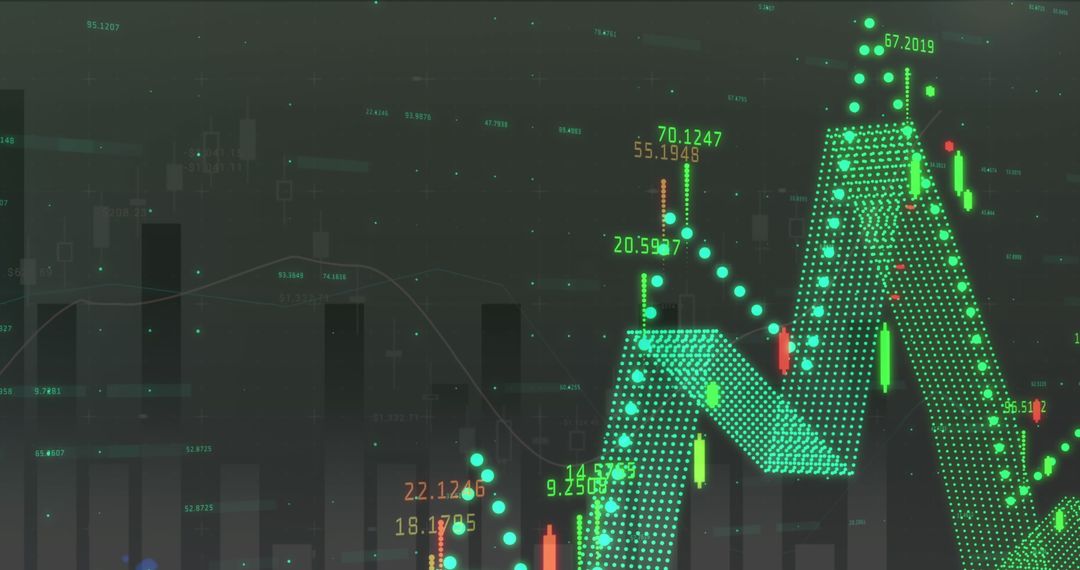
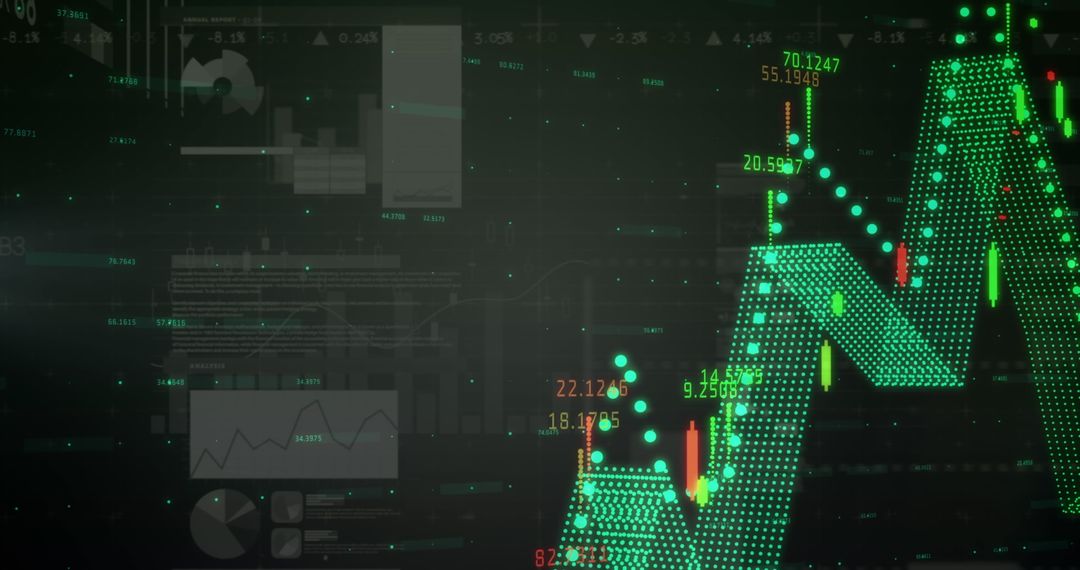
- Green Dotted Market Mesh Chart Displaying Candlestick Patterns and Volatility Dashboard
Green Dotted Market Mesh Chart Displaying Candlestick Patterns and Volatility Dashboard Image
Showing green dotted mesh chart with candlestick markers, waveform overlay and neon grid highlights on dark background. Highlighting market volatility, price momentum and trading signals for financial analysis and investment content. Suitable for use in finance reports, investor presentations, trading platform dashboards, website hero banners, social media ads and educational materials. Ideal for illustrating algorithmic trading concepts, risk analysis, market research visuals and product marketing for fintech brands. High contrast neon palette and clean grid composition making image easy to integrate into print and digital layouts with overlay text, icons and graphs.
Powered by 


0
downloads
downloads
Tags:
More
Credit Photo
If you would like to credit the Photo, here are some ways you can do so
Text Link
photo Link
<span class="text-link">
<span>
<a target="_blank" href=https://pikwizard.com/photo/green-dotted-market-mesh-chart-displaying-candlestick-patterns-and-volatility-dashboard/5f03690deb49ce04c4c00db1b70557c8/>PikWizard</a>
</span>
</span>
<span class="image-link">
<span
style="margin: 0 0 20px 0; display: inline-block; vertical-align: middle; width: 100%;"
>
<a
target="_blank"
href="https://pikwizard.com/photo/green-dotted-market-mesh-chart-displaying-candlestick-patterns-and-volatility-dashboard/5f03690deb49ce04c4c00db1b70557c8/"
style="text-decoration: none; font-size: 10px; margin: 0;"
>
<img src="https://pikwizard.com/pw/medium/5f03690deb49ce04c4c00db1b70557c8.jpg" style="margin: 0; width: 100%;" alt="" />
<p style="font-size: 12px; margin: 0;">PikWizard</p>
</a>
</span>
</span>
Free (free of charge)
Free for personal and commercial use.
Author: Creative Art
Similar Free Stock Images

Premium


Premium


Premium


Premium


Premium


Premium


Premium


Premium


Premium


Premium


Premium


Premium


Premium


Premium


Premium


Premium


Premium


Premium


Premium


Premium


Premium


Premium


Premium


Premium