
- Home >
- Stock Photos >
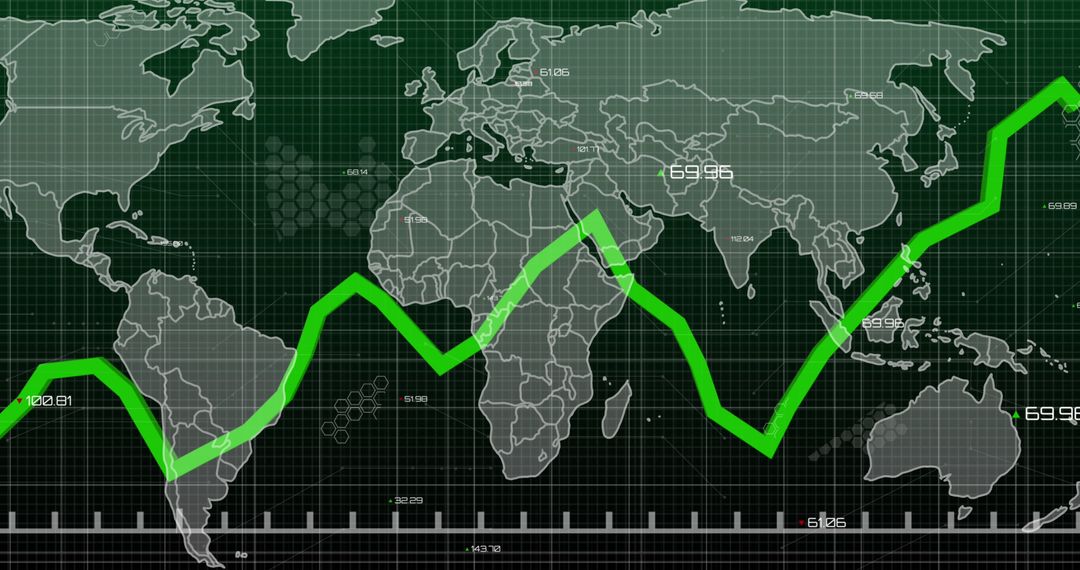
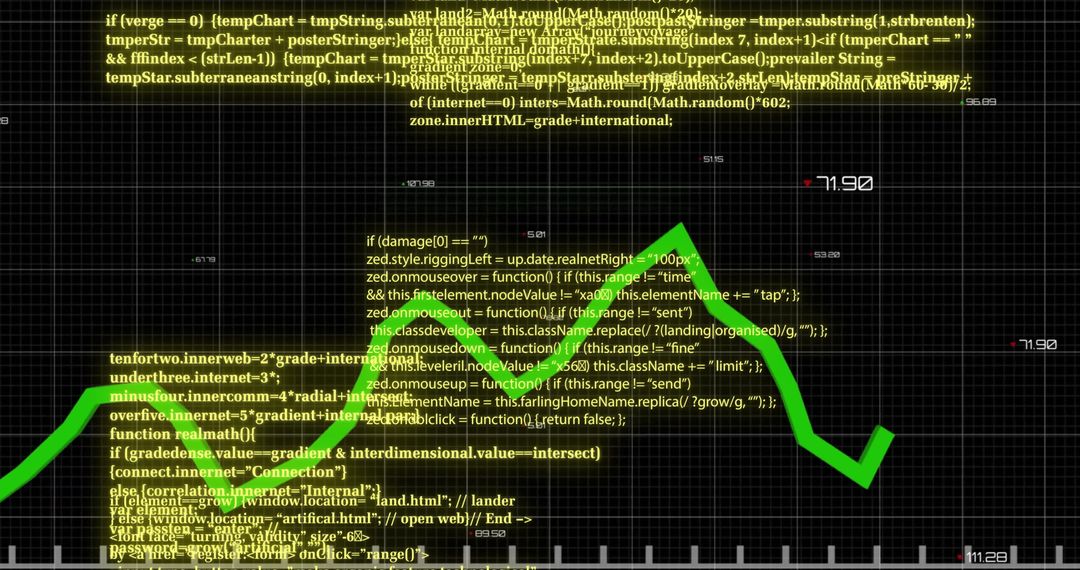
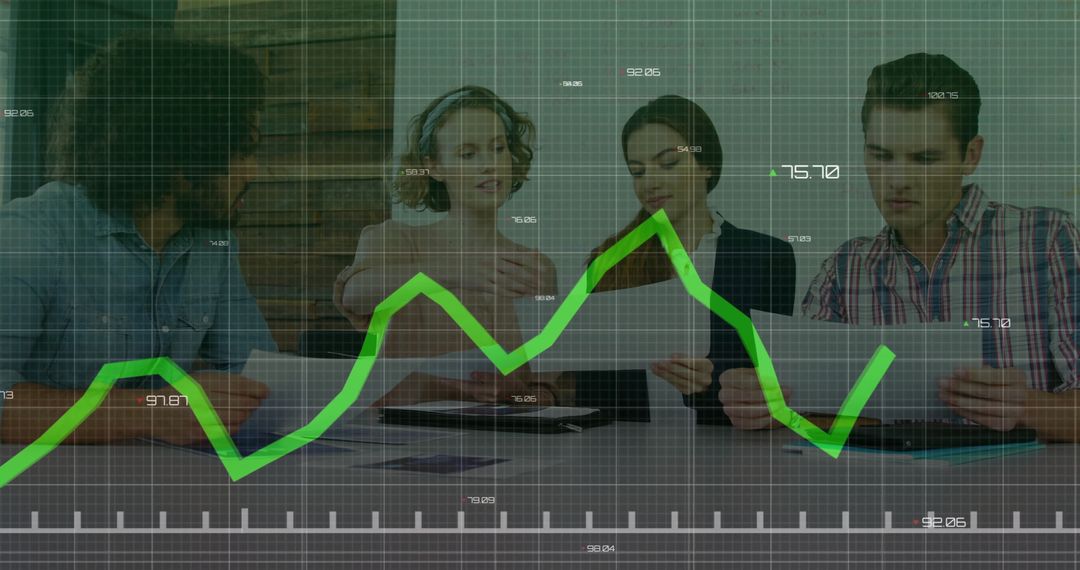
- Green Financial Data Chart with Technological Overlay
Green Financial Data Chart with Technological Overlay Image

Green line graph displaying financial data against grid backdrop symbolizes economic trends with digital overlay suggesting technology integration. Represents data processing in finance sector, digital economy, stock analysis. Perfect for economic presentations, business report visualizations, finance industry marketing.
Powered by  - Get 15% off with code: PIKWIZARD15


2
downloads
downloads
Tags:
More
Credit Photo
If you would like to credit the Photo, here are some ways you can do so
Text Link
photo Link
<span class="text-link">
<span>
<a target="_blank" href=https://pikwizard.com/photo/green-financial-data-chart-with-technological-overlay/e8c74986f30ab8631387ab194b6d679b/>PikWizard</a>
</span>
</span>
<span class="image-link">
<span
style="margin: 0 0 20px 0; display: inline-block; vertical-align: middle; width: 100%;"
>
<a
target="_blank"
href="https://pikwizard.com/photo/green-financial-data-chart-with-technological-overlay/e8c74986f30ab8631387ab194b6d679b/"
style="text-decoration: none; font-size: 10px; margin: 0;"
>
<img src="https://pikwizard.com/pw/medium/e8c74986f30ab8631387ab194b6d679b.jpg" style="margin: 0; width: 100%;" alt="" />
<p style="font-size: 12px; margin: 0;">PikWizard</p>
</a>
</span>
</span>
Free (free of charge)
Free for personal and commercial use.
Author: People Creations
Similar Free Stock Images

Premium


Premium


Premium


Premium


Premium


Premium


Premium


Premium


Premium


Premium


Premium


Premium


Premium


Premium


Premium


Premium


Premium


Premium


Premium


Premium


Premium


Premium


Premium


Premium

