- Home >
- Stock Photos >
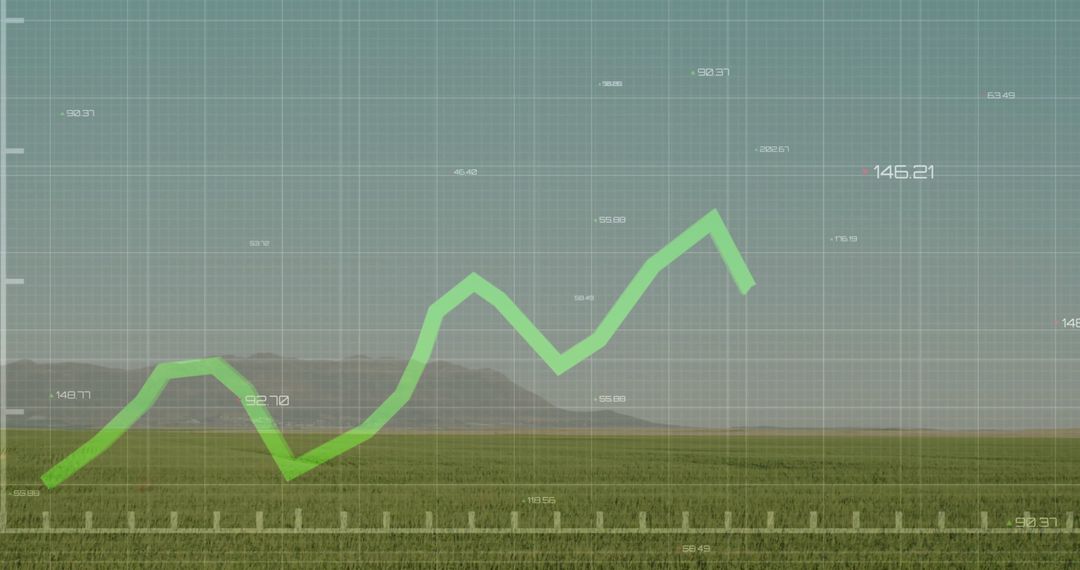
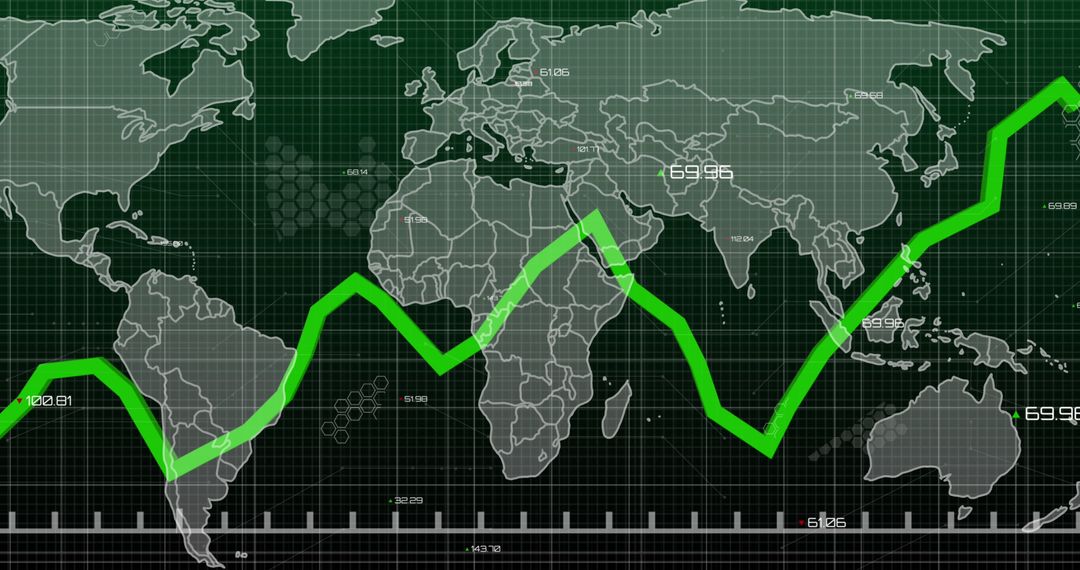
- Green Graph Showing Forex Trends on Transparent Cyber Interface
Green Graph Showing Forex Trends on Transparent Cyber Interface Image

Abstract representation of currency or stock market trends with green graph against city skyline background. Image conveys themes of global finance, real-time analytics, and technological advancement in business. Ideal for use in presentations or articles about finance, investment, surveillance technology, or economic predictions.
Powered by 


2
downloads
downloads
Tags:
More
Credit Photo
If you would like to credit the Photo, here are some ways you can do so
Text Link
photo Link
<span class="text-link">
<span>
<a target="_blank" href=https://pikwizard.com/photo/green-graph-showing-forex-trends-on-transparent-cyber-interface/72107a26494a7e1631131b3792754be2/>PikWizard</a>
</span>
</span>
<span class="image-link">
<span
style="margin: 0 0 20px 0; display: inline-block; vertical-align: middle; width: 100%;"
>
<a
target="_blank"
href="https://pikwizard.com/photo/green-graph-showing-forex-trends-on-transparent-cyber-interface/72107a26494a7e1631131b3792754be2/"
style="text-decoration: none; font-size: 10px; margin: 0;"
>
<img src="https://pikwizard.com/pw/medium/72107a26494a7e1631131b3792754be2.jpg" style="margin: 0; width: 100%;" alt="" />
<p style="font-size: 12px; margin: 0;">PikWizard</p>
</a>
</span>
</span>
Free (free of charge)
Free for personal and commercial use.
Author: Awesome Content
Similar Free Stock Images

Premium


Premium


Premium


Premium


Premium


Premium


Premium


Premium


Premium


Premium


Premium


Premium


Premium


Premium


Premium


Premium


Premium


Premium


Premium