
- Home >
- Stock Photos >
- Green Line Chart Display on Digital Interface
Green Line Chart Display on Digital Interface Image
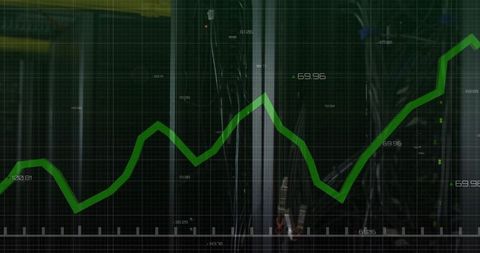
This visual features a green fluctuating line graph overlaying a reflective grid interface, with visible numeric labels. Perfect for themes related to data analysis, financial trends, technology, digital markets, or cybersecurity presentations. It can convey concepts related to modern business dynamics or tech advancements in data handling.
Powered by  - Get 15% off with code: PIKWIZARD15


0
downloads
downloads
Tags:
More
Credit Photo
If you would like to credit the Photo, here are some ways you can do so
Text Link
photo Link
<span class="text-link">
<span>
<a target="_blank" href=https://pikwizard.com/photo/green-line-chart-display-on-digital-interface/85b6fb635a6755e35103331589c160ca/>PikWizard</a>
</span>
</span>
<span class="image-link">
<span
style="margin: 0 0 20px 0; display: inline-block; vertical-align: middle; width: 100%;"
>
<a
target="_blank"
href="https://pikwizard.com/photo/green-line-chart-display-on-digital-interface/85b6fb635a6755e35103331589c160ca/"
style="text-decoration: none; font-size: 10px; margin: 0;"
>
<img src="https://pikwizard.com/pw/medium/85b6fb635a6755e35103331589c160ca.jpg" style="margin: 0; width: 100%;" alt="" />
<p style="font-size: 12px; margin: 0;">PikWizard</p>
</a>
</span>
</span>
Free (free of charge)
Free for personal and commercial use.
Author: People Creations