- Home >
- Stock Photos >
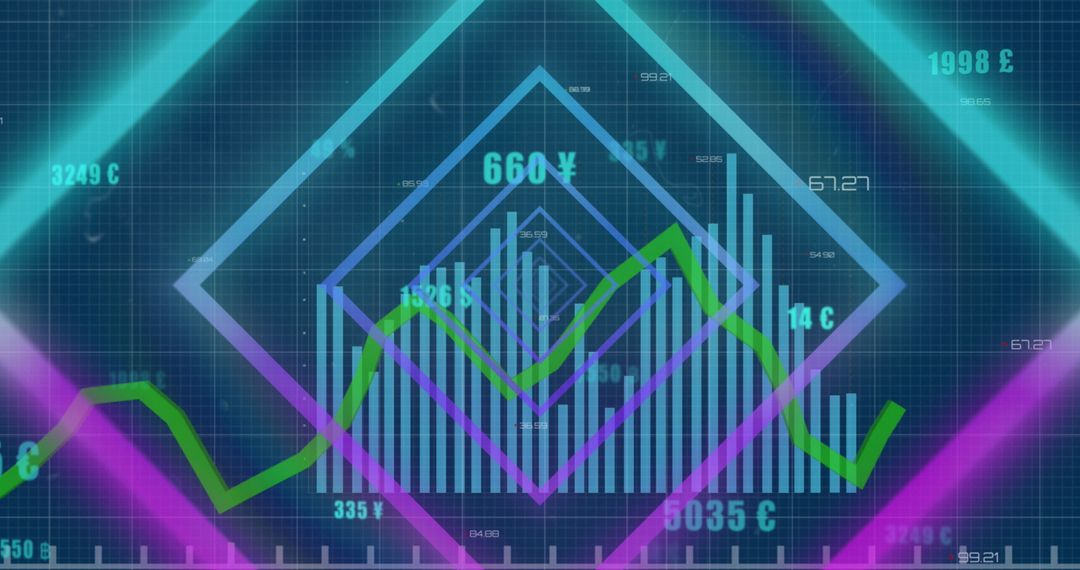
- Green Line Chart Overlay on Dark Financial Data Background
Green Line Chart Overlay on Dark Financial Data Background Image

Depicts business and financial analysis themes. Bar graphs and currency symbols correspond to various financial data points, ideal for illustrating articles and presentations on global trade, economic trends, or digital finance.
Powered by  - Get 15% off with code: PIKWIZARD15


3
downloads
downloads
Tags:
More
Credit Photo
If you would like to credit the Photo, here are some ways you can do so
Text Link
photo Link
<span class="text-link">
<span>
<a target="_blank" href=https://pikwizard.com/photo/green-line-chart-overlay-on-dark-financial-data-background/0b21e2bb1c87018efa41650b08515628/>PikWizard</a>
</span>
</span>
<span class="image-link">
<span
style="margin: 0 0 20px 0; display: inline-block; vertical-align: middle; width: 100%;"
>
<a
target="_blank"
href="https://pikwizard.com/photo/green-line-chart-overlay-on-dark-financial-data-background/0b21e2bb1c87018efa41650b08515628/"
style="text-decoration: none; font-size: 10px; margin: 0;"
>
<img src="https://pikwizard.com/pw/medium/0b21e2bb1c87018efa41650b08515628.jpg" style="margin: 0; width: 100%;" alt="" />
<p style="font-size: 12px; margin: 0;">PikWizard</p>
</a>
</span>
</span>
Free (free of charge)
Free for personal and commercial use.
Author: Awesome Content
Similar Free Stock Images

Premium


Premium


Premium


Premium


Premium


Premium


Premium


Premium


Premium


Premium


Premium


Premium


Premium


Premium


Premium


Premium


Premium


Premium


Premium


Premium


Premium


Premium


Premium


Premium