- Home >
- Stock Photos >
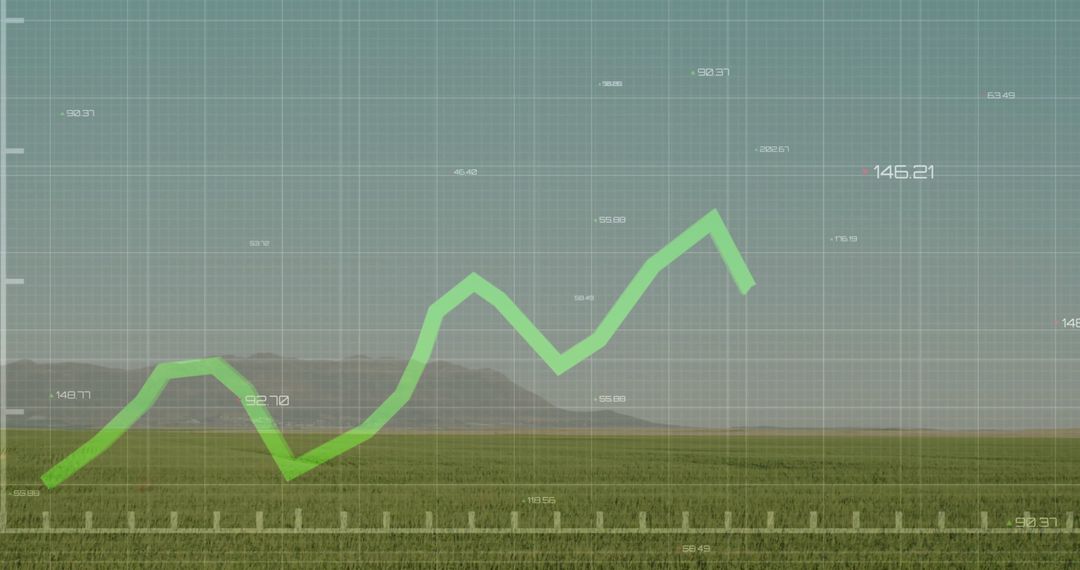
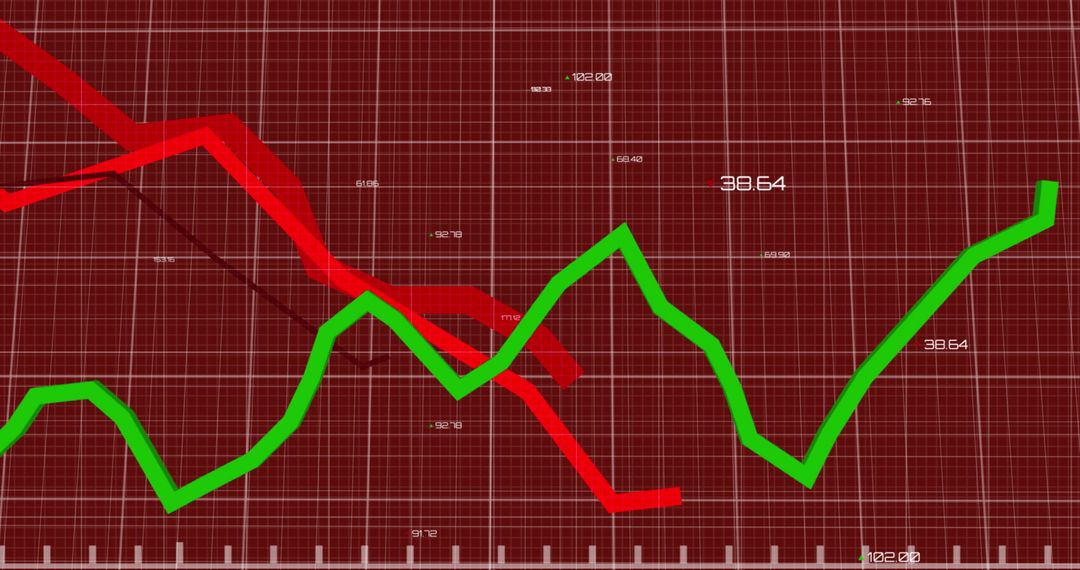
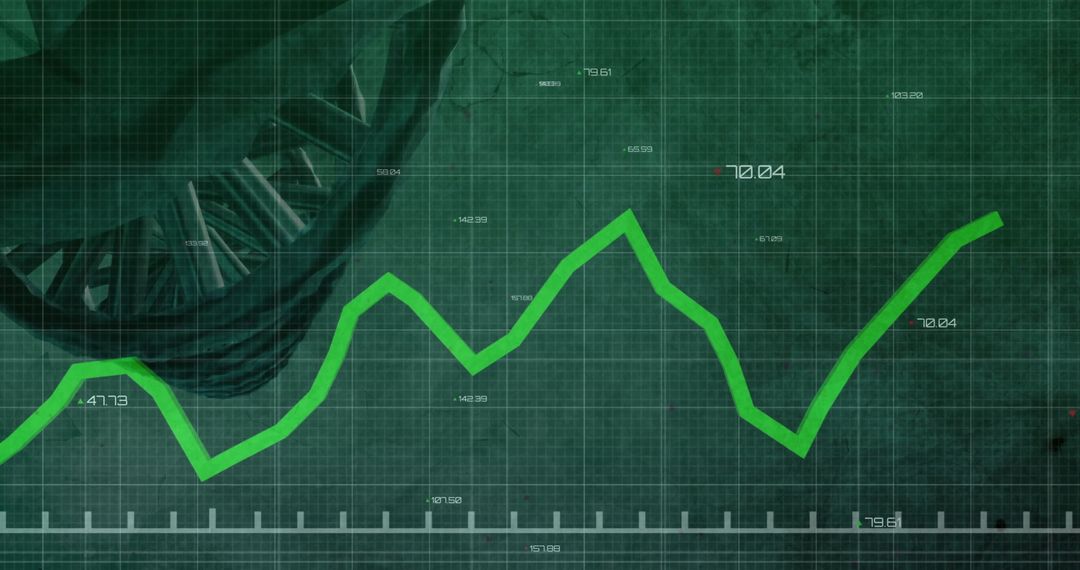
- Green Line Graph Over Industrial Metal Beams Illustrating Data Analytics
Green Line Graph Over Industrial Metal Beams Illustrating Data Analytics Image
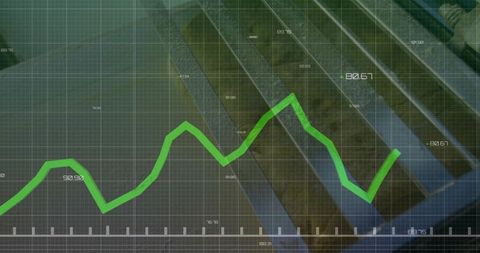
This digital concept combines data analytics with industrial design, featuring a green line graph and numeric labels across diagonal metal beams. Ideal for themes around technology, finance, industry futures, data science presentations, corporate reports, or a visual emphasizing the merging of physical infrastructure with digital information landscapes.
Powered by  - Get 15% off with code: PIKWIZARD15


0
downloads
downloads
Tags:
More
Credit Photo
If you would like to credit the Photo, here are some ways you can do so
Text Link
photo Link
<span class="text-link">
<span>
<a target="_blank" href=https://pikwizard.com/photo/green-line-graph-over-industrial-metal-beams-illustrating-data-analytics/b33e9df3a2128bed7cd0de8b721d69be/>PikWizard</a>
</span>
</span>
<span class="image-link">
<span
style="margin: 0 0 20px 0; display: inline-block; vertical-align: middle; width: 100%;"
>
<a
target="_blank"
href="https://pikwizard.com/photo/green-line-graph-over-industrial-metal-beams-illustrating-data-analytics/b33e9df3a2128bed7cd0de8b721d69be/"
style="text-decoration: none; font-size: 10px; margin: 0;"
>
<img src="https://pikwizard.com/pw/medium/b33e9df3a2128bed7cd0de8b721d69be.jpg" style="margin: 0; width: 100%;" alt="" />
<p style="font-size: 12px; margin: 0;">PikWizard</p>
</a>
</span>
</span>
Free (free of charge)
Free for personal and commercial use.
Author: Authentic Images
Similar Free Stock Images

Premium


Premium


Premium


Premium


Premium


Premium


Premium


Premium


Premium


Premium


Premium


Premium


Premium


Premium


Premium


Premium


Premium


Premium


Premium


Premium


Premium


Premium


Premium


Premium