
- Home >
- Stock Photos >
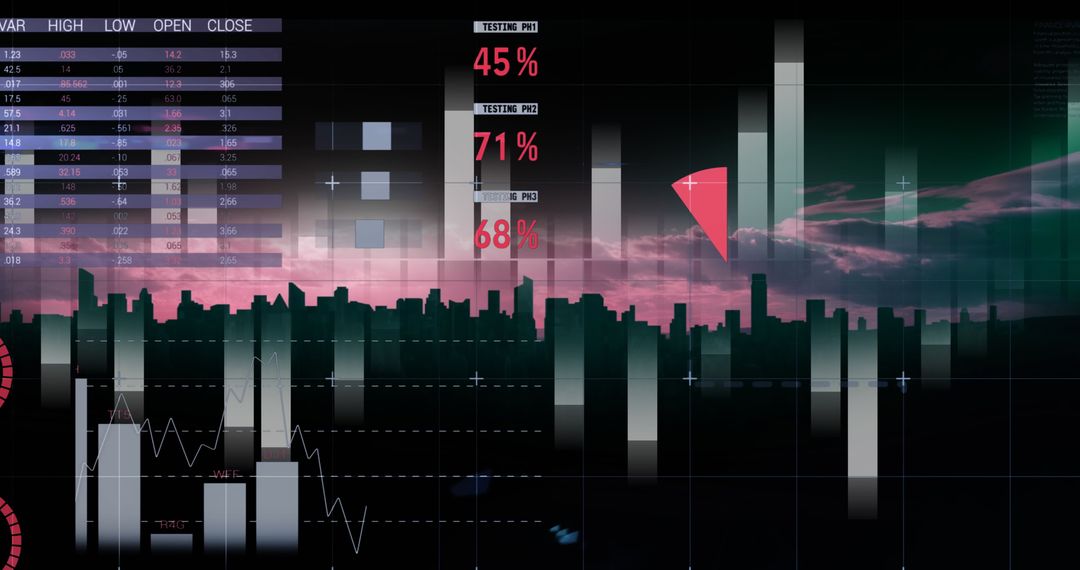
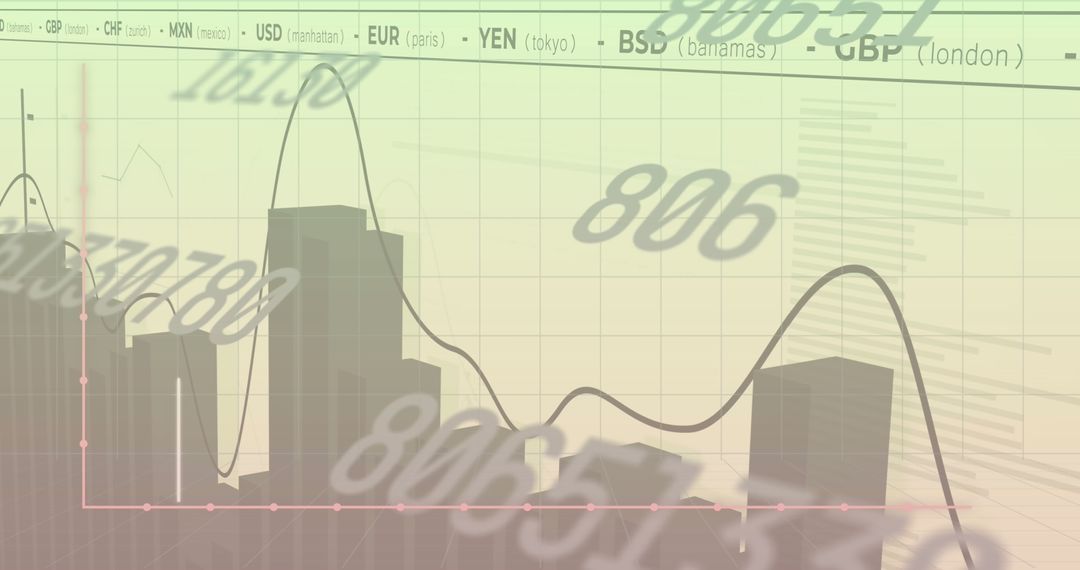
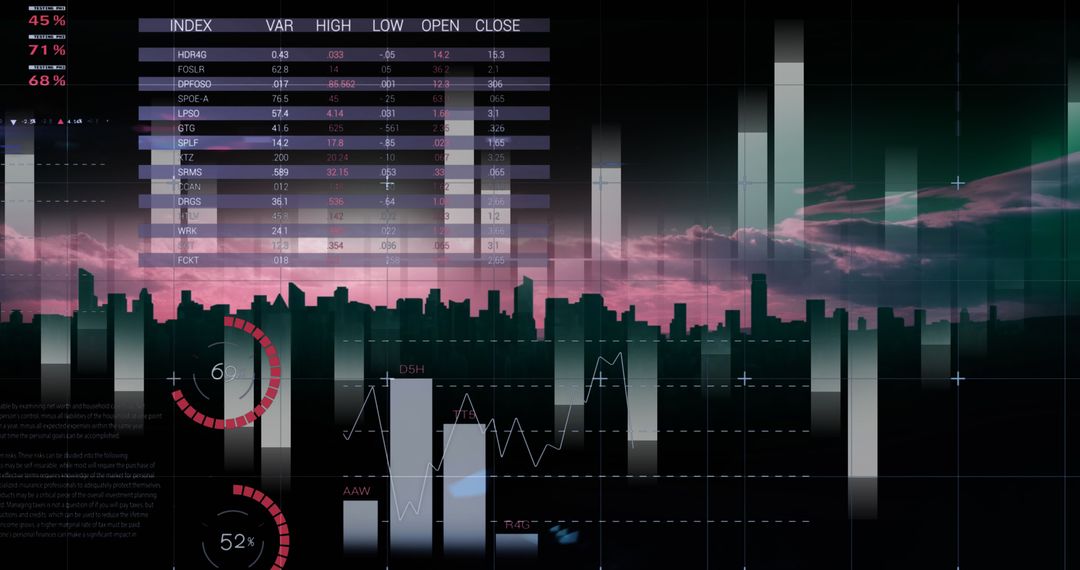
- Holographic Currency Charts and Digital Data Flow in Financial Market
Holographic Currency Charts and Digital Data Flow in Financial Market Image

Abstract representation of financial charts and currency symbols. Shows fluctuating data indicative of trading activities in global markets. Perfect for illustrating financial reports, educational materials on forex trading, or creating new graphics for banking and economic trends.
Powered by  - Get 15% off with code: PIKWIZARD15


6
downloads
downloads
Tags:
More
Credit Photo
If you would like to credit the Photo, here are some ways you can do so
Text Link
photo Link
<span class="text-link">
<span>
<a target="_blank" href=https://pikwizard.com/photo/holographic-currency-charts-and-digital-data-flow-in-financial-market/44417c345baea1cb91d9d8149ebe426a/>PikWizard</a>
</span>
</span>
<span class="image-link">
<span
style="margin: 0 0 20px 0; display: inline-block; vertical-align: middle; width: 100%;"
>
<a
target="_blank"
href="https://pikwizard.com/photo/holographic-currency-charts-and-digital-data-flow-in-financial-market/44417c345baea1cb91d9d8149ebe426a/"
style="text-decoration: none; font-size: 10px; margin: 0;"
>
<img src="https://pikwizard.com/pw/medium/44417c345baea1cb91d9d8149ebe426a.jpg" style="margin: 0; width: 100%;" alt="" />
<p style="font-size: 12px; margin: 0;">PikWizard</p>
</a>
</span>
</span>
Free (free of charge)
Free for personal and commercial use.
Author: Creative Art
Similar Free Stock Images

Premium


Premium


Premium


Premium


Premium


Premium


Premium


Premium


Premium


Premium


Premium


Premium


Premium


Premium


Premium


Premium


Premium


Premium


Premium


Premium


Premium


Premium


Premium


Premium

