- Home >
- Stock Photos >
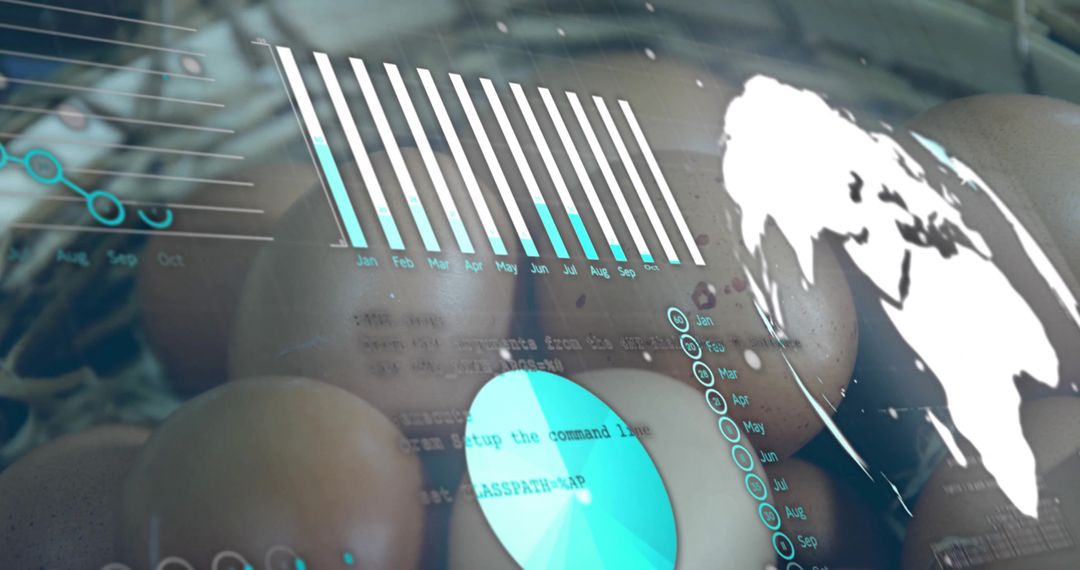
- Holographic data dashboard over laptop workspace showing global analytics, bar and pie charts
Holographic data dashboard over laptop workspace showing global analytics, bar and pie charts Image
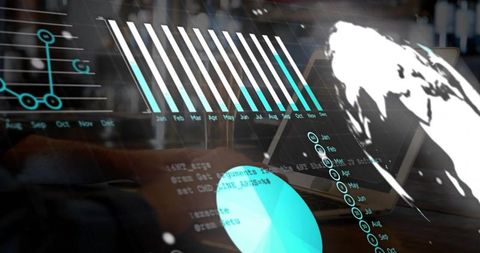
Showing holographic dashboard with bar and pie charts floating over laptop, globe overlay creating global analytics theme. Filling dim office workspace with futuristic data overlays and subtle code snippets, conveying tech-driven collaboration and remote teamwork. Suiting website hero banners, corporate presentations, investor pitch decks, fintech marketing, data science reports, cybersecurity and cloud service promotions. Encouraging use as slide backgrounds, blog headers, social media ads, annual report covers, product landing pages, or concept art for UI and augmented reality demonstrations.
Powered by  - Get 15% off with code: PIKWIZARD15


0
downloads
downloads
Tags:
More
Credit Photo
If you would like to credit the Photo, here are some ways you can do so
Text Link
photo Link
<span class="text-link">
<span>
<a target="_blank" href=https://pikwizard.com/photo/holographic-data-dashboard-over-laptop-workspace-showing-global-analytics-bar-and-pie-charts/90c2641161dc8e7f433f9e54c42a67ae/>PikWizard</a>
</span>
</span>
<span class="image-link">
<span
style="margin: 0 0 20px 0; display: inline-block; vertical-align: middle; width: 100%;"
>
<a
target="_blank"
href="https://pikwizard.com/photo/holographic-data-dashboard-over-laptop-workspace-showing-global-analytics-bar-and-pie-charts/90c2641161dc8e7f433f9e54c42a67ae/"
style="text-decoration: none; font-size: 10px; margin: 0;"
>
<img src="https://pikwizard.com/pw/medium/90c2641161dc8e7f433f9e54c42a67ae.jpg" style="margin: 0; width: 100%;" alt="" />
<p style="font-size: 12px; margin: 0;">PikWizard</p>
</a>
</span>
</span>
Free (free of charge)
Free for personal and commercial use.
Author: Creative Art
Similar Free Stock Images

Premium


Premium


Premium


Premium


Premium


Premium


Premium


Premium


Premium


Premium


Premium


Premium


Premium


Premium


Premium


Premium


Premium


Premium


Premium


Premium


Premium


Premium


Premium


Premium