
- Home >
- Stock Photos >
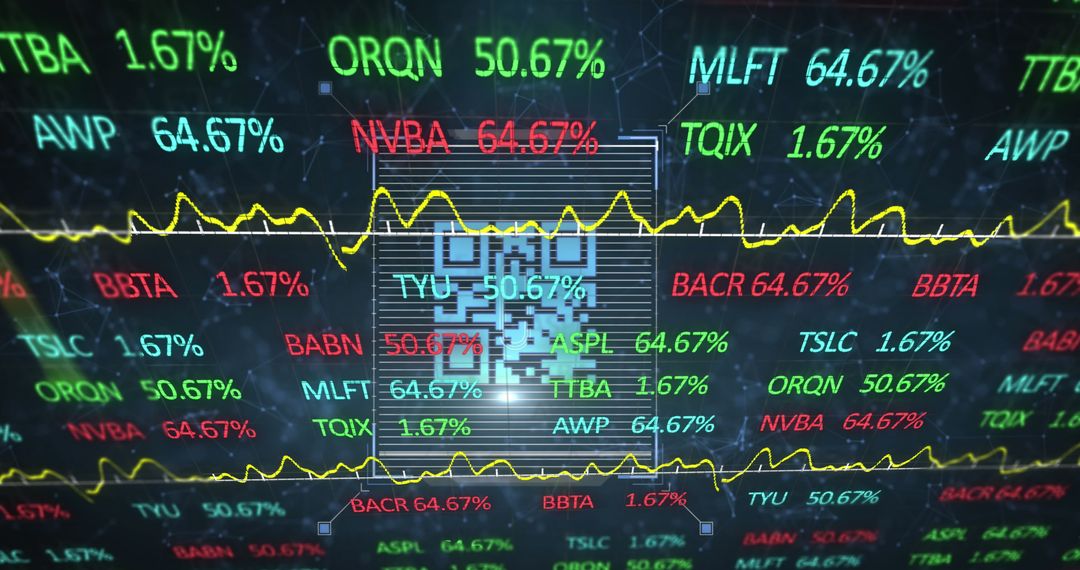
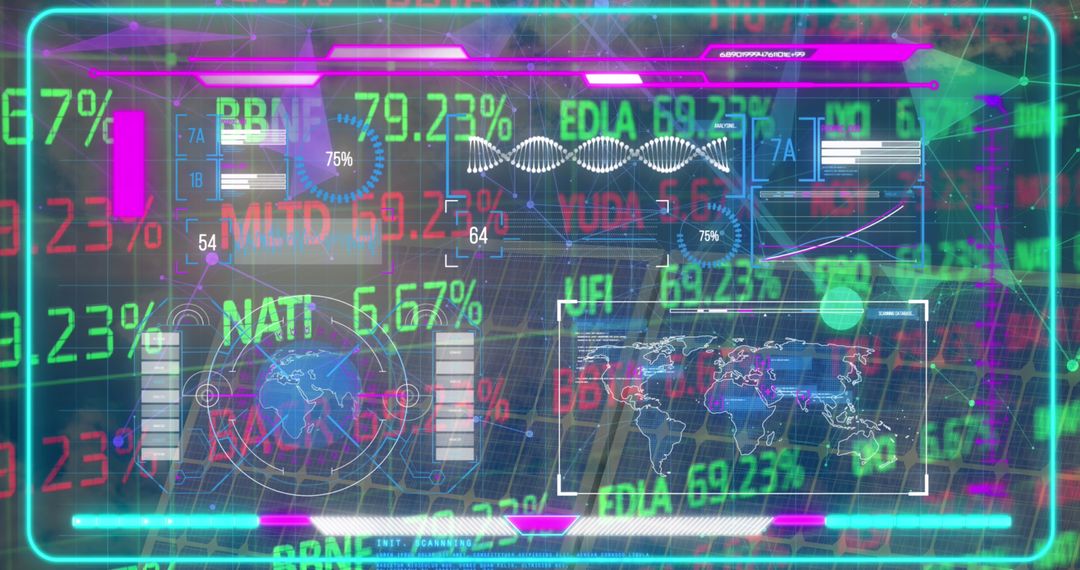
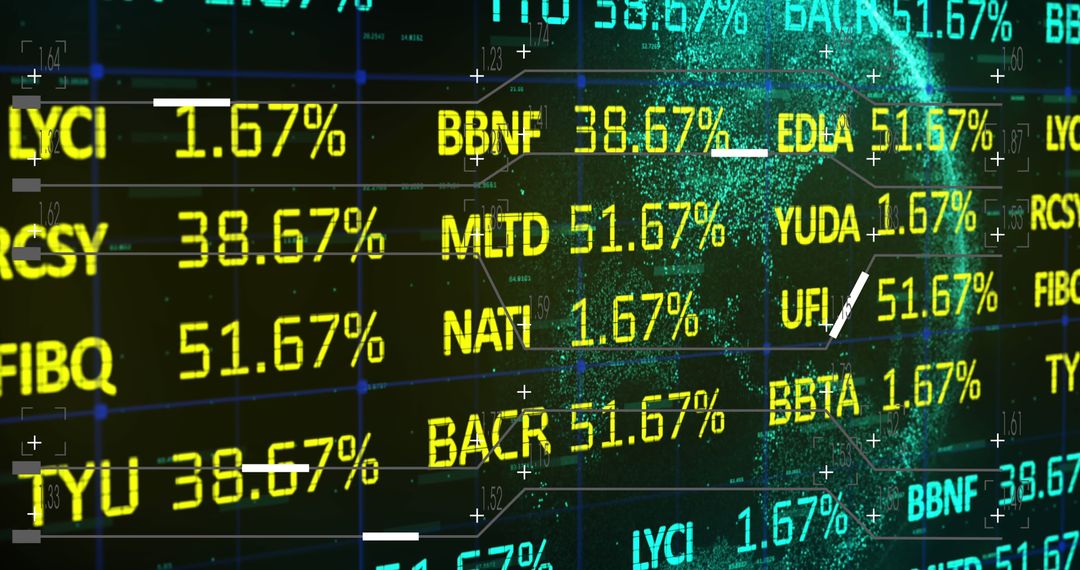
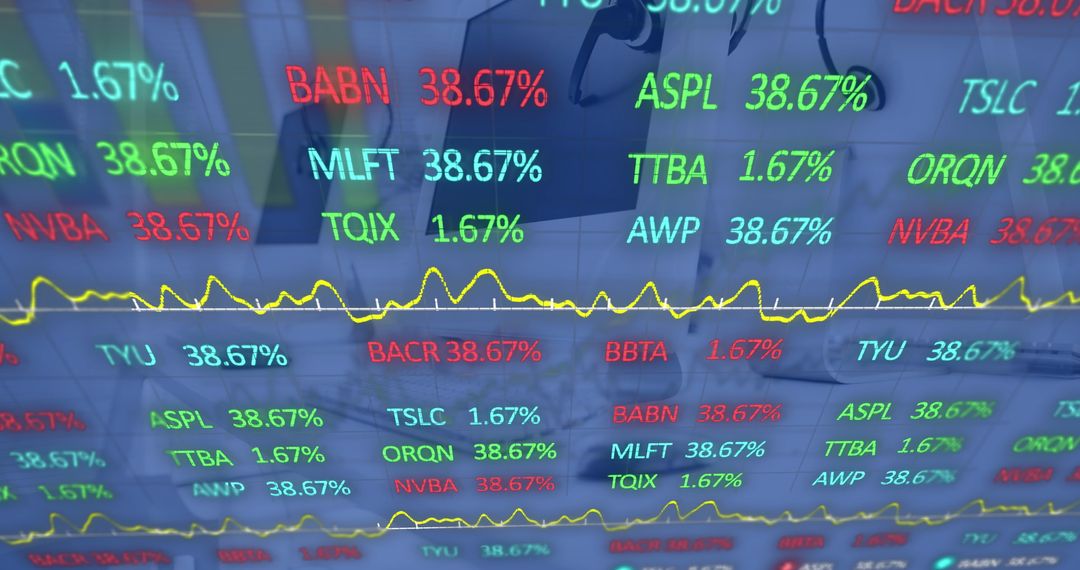
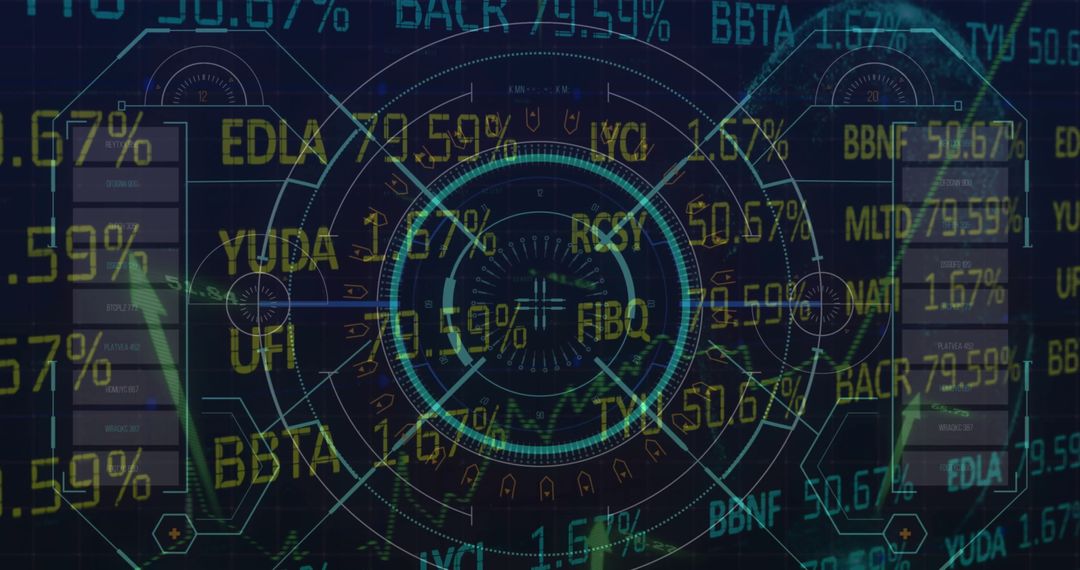
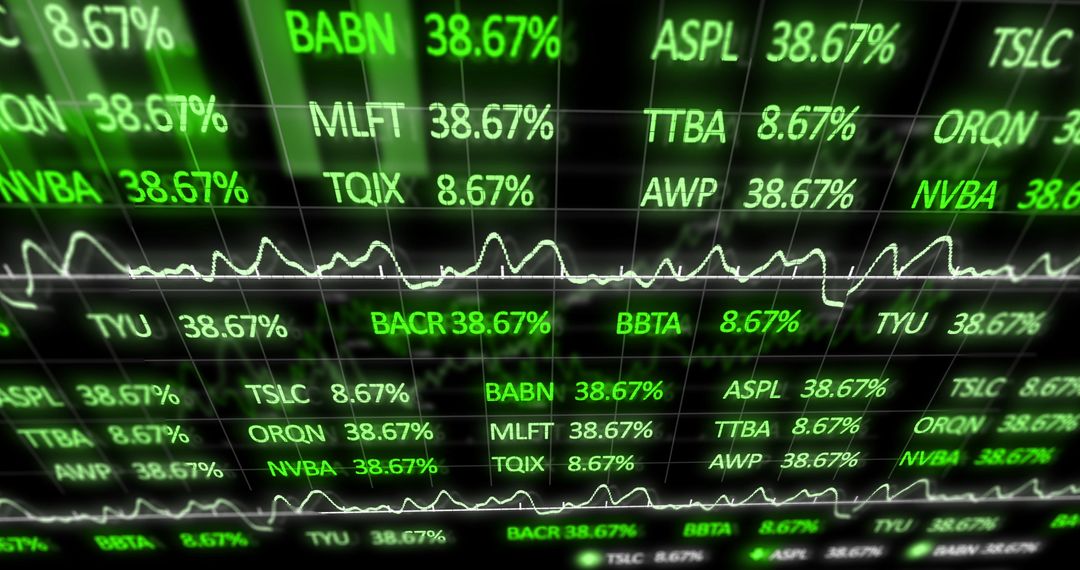
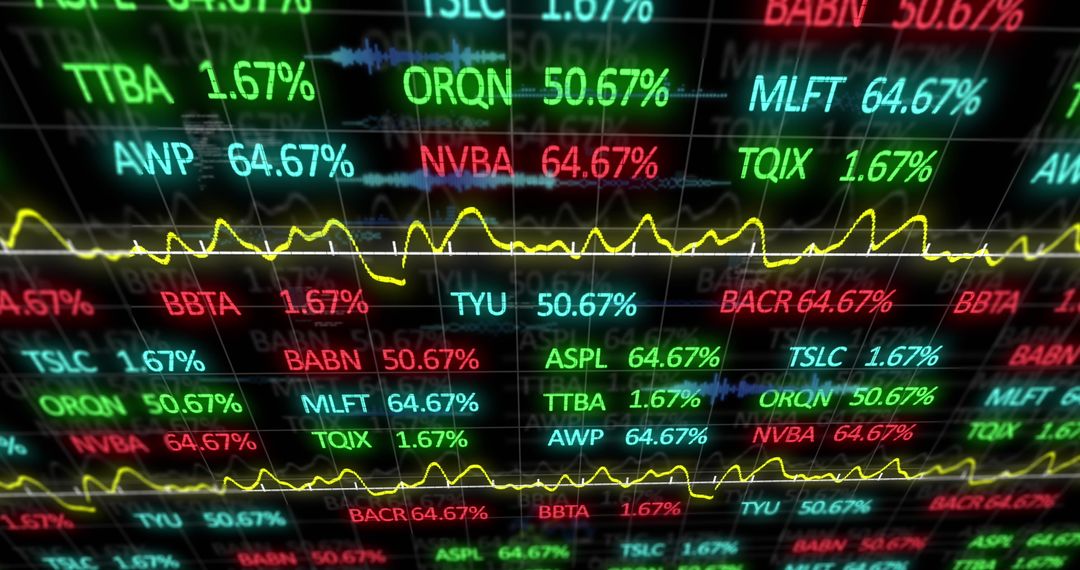
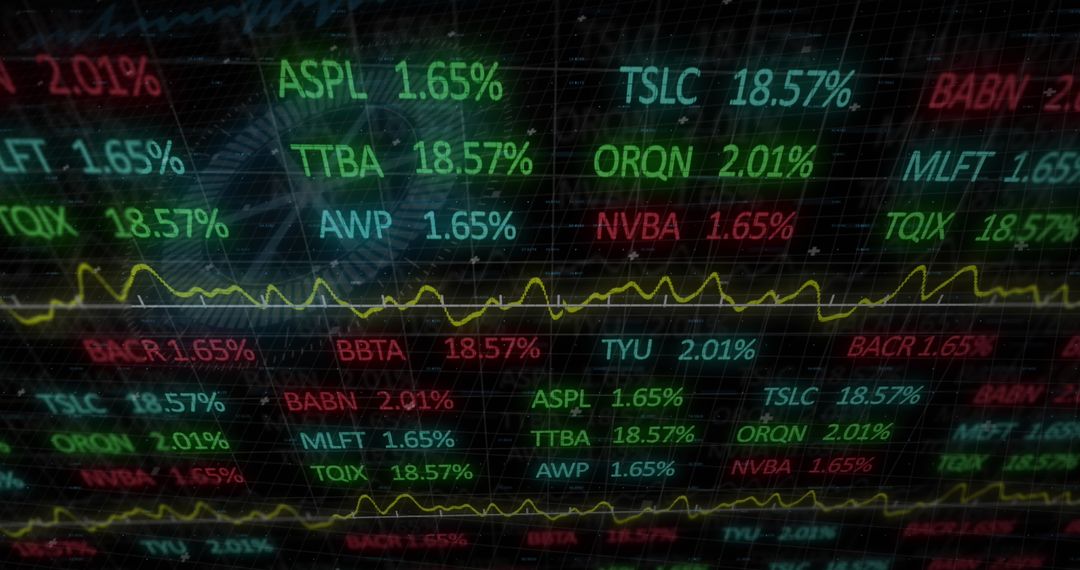
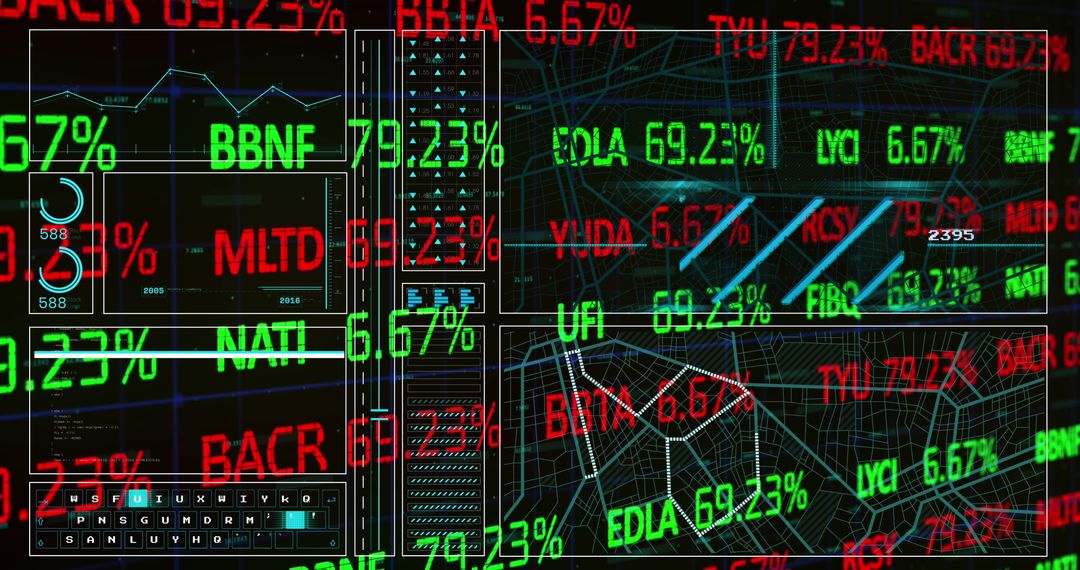
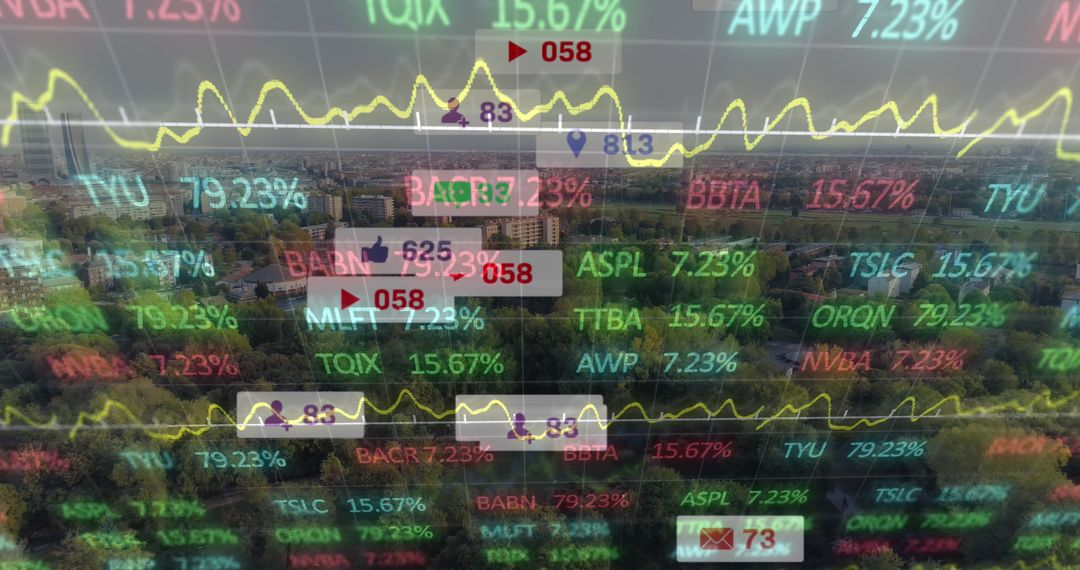
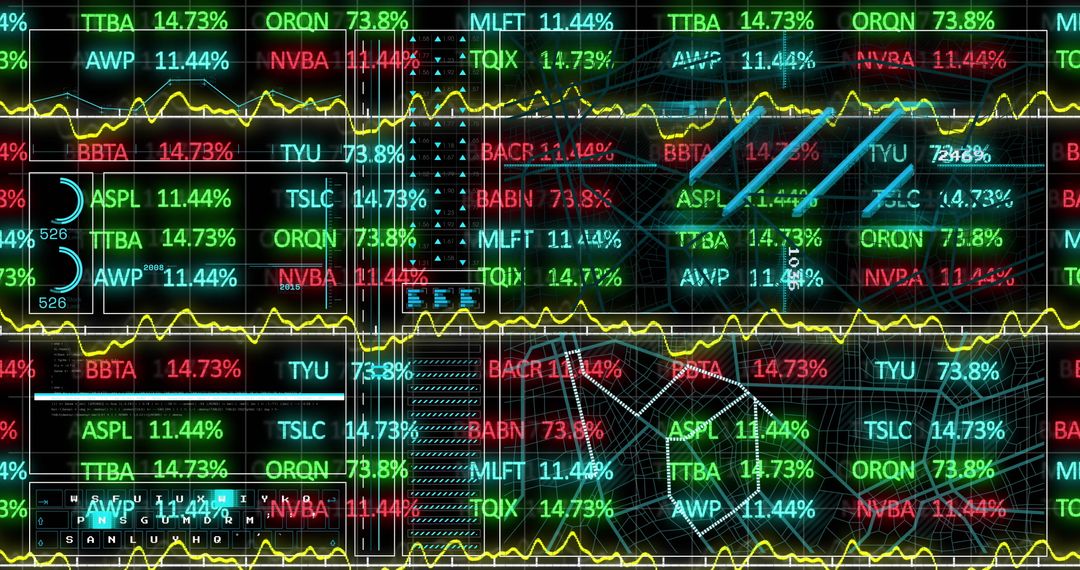
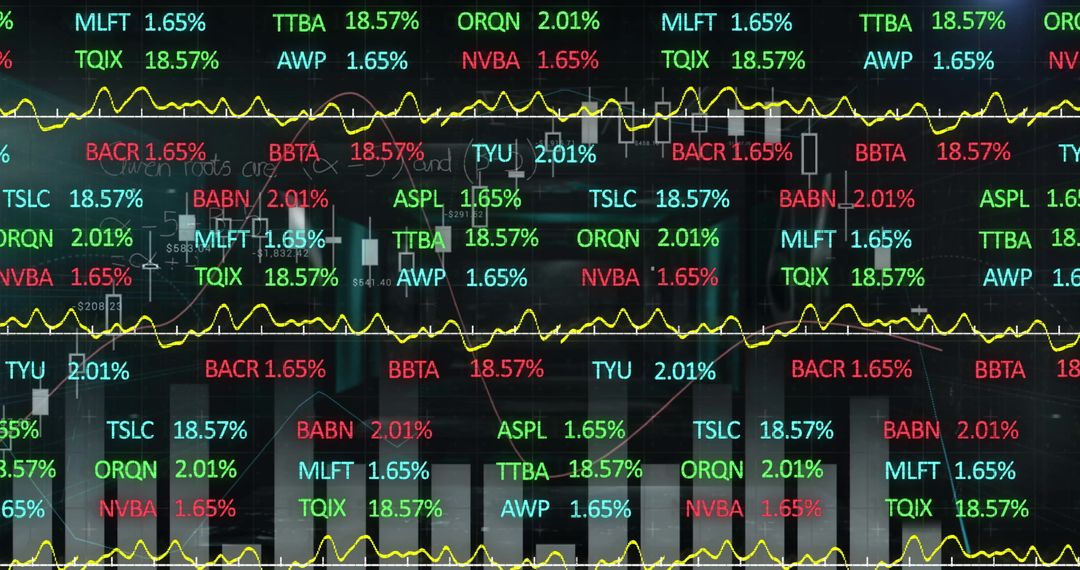
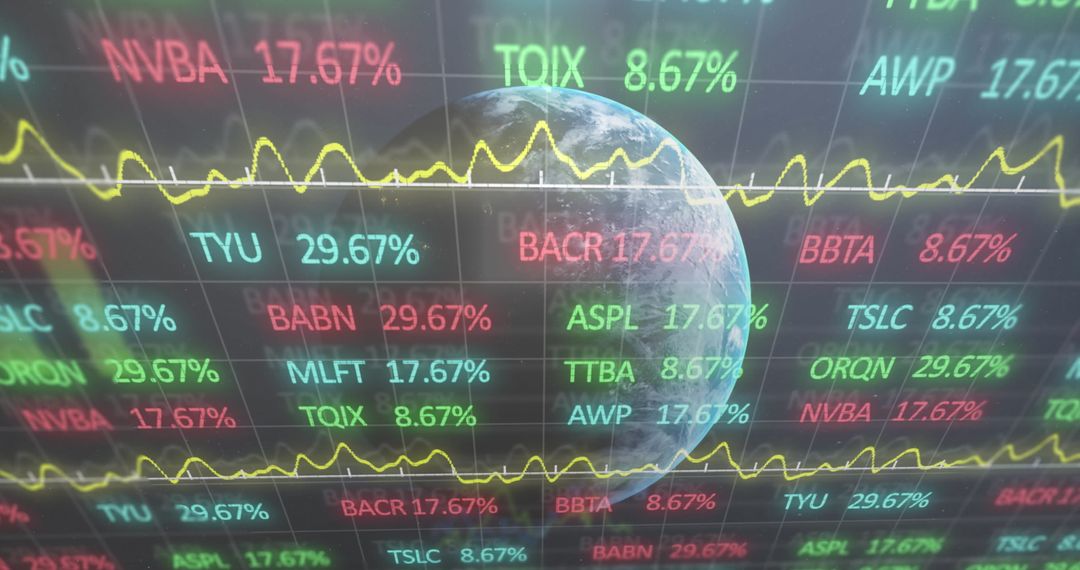
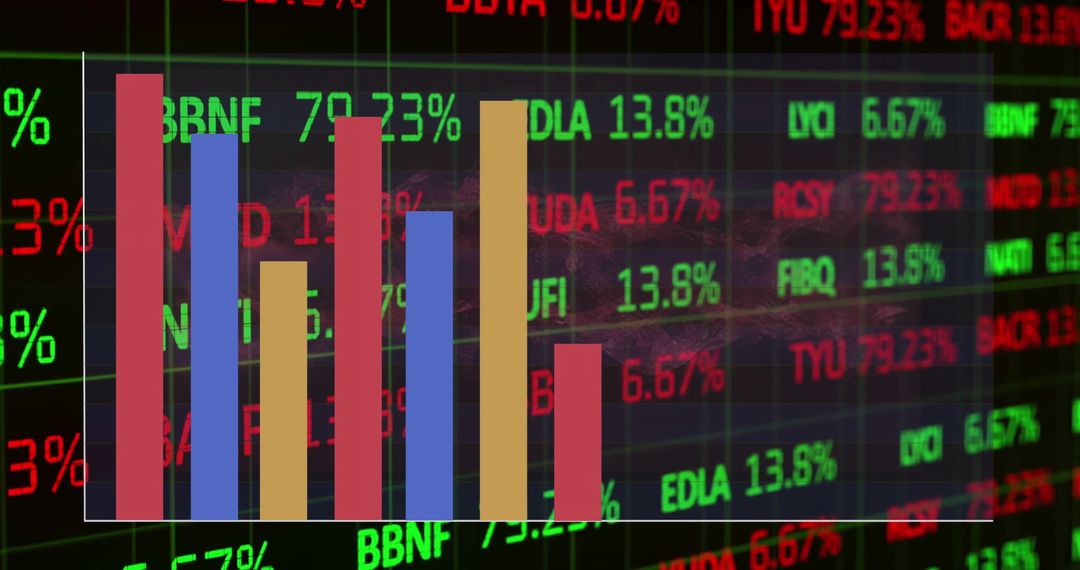
- Holographic Stock Market Trading Interface with Infographics
Holographic Stock Market Trading Interface with Infographics Image
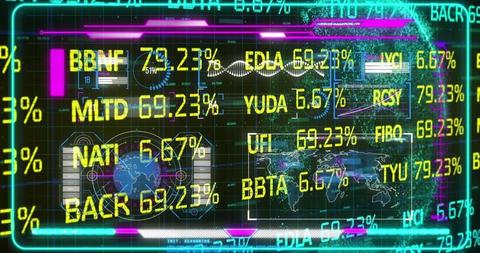
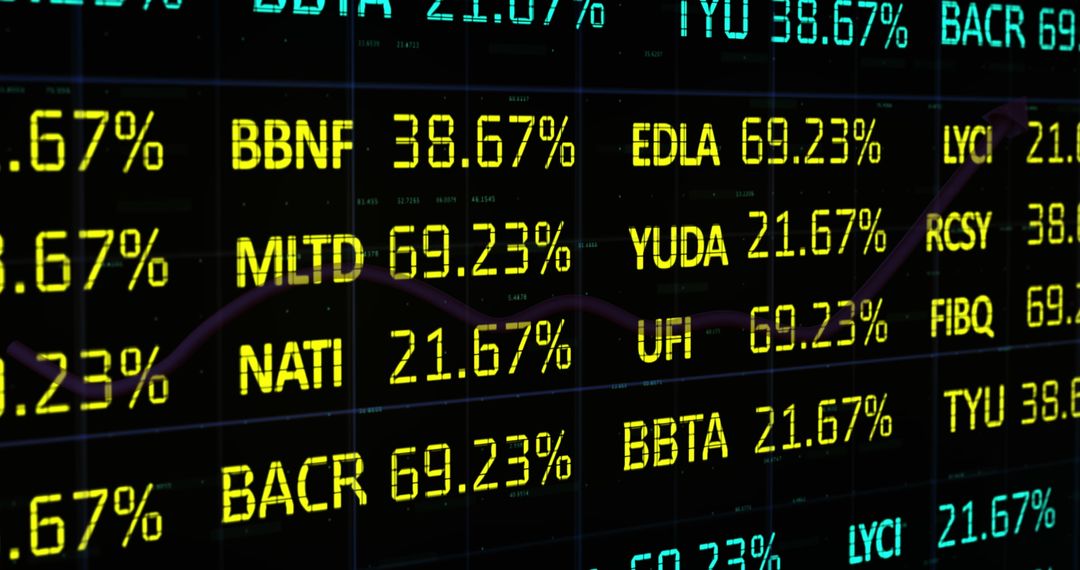
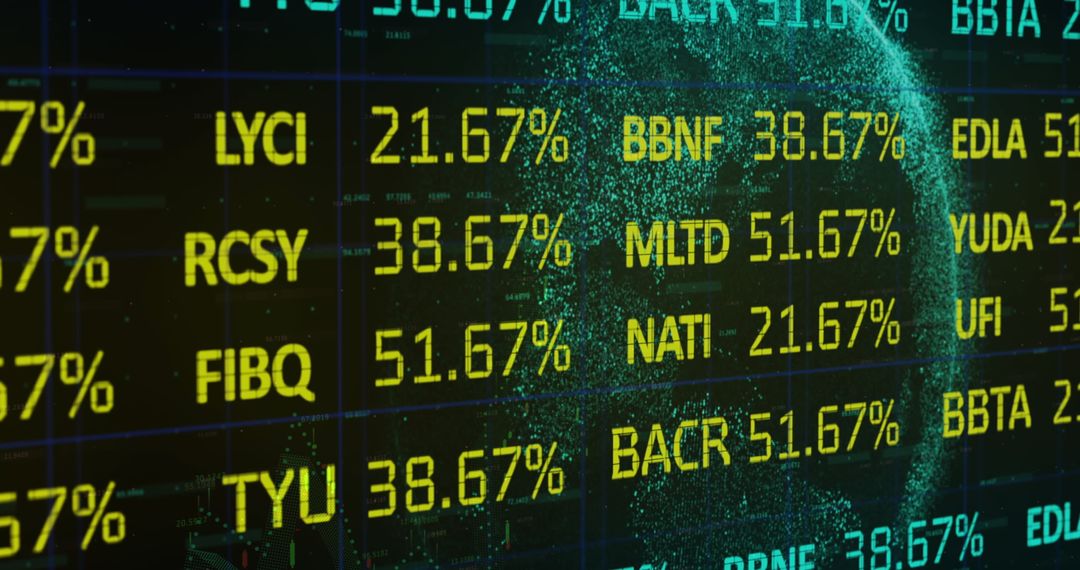
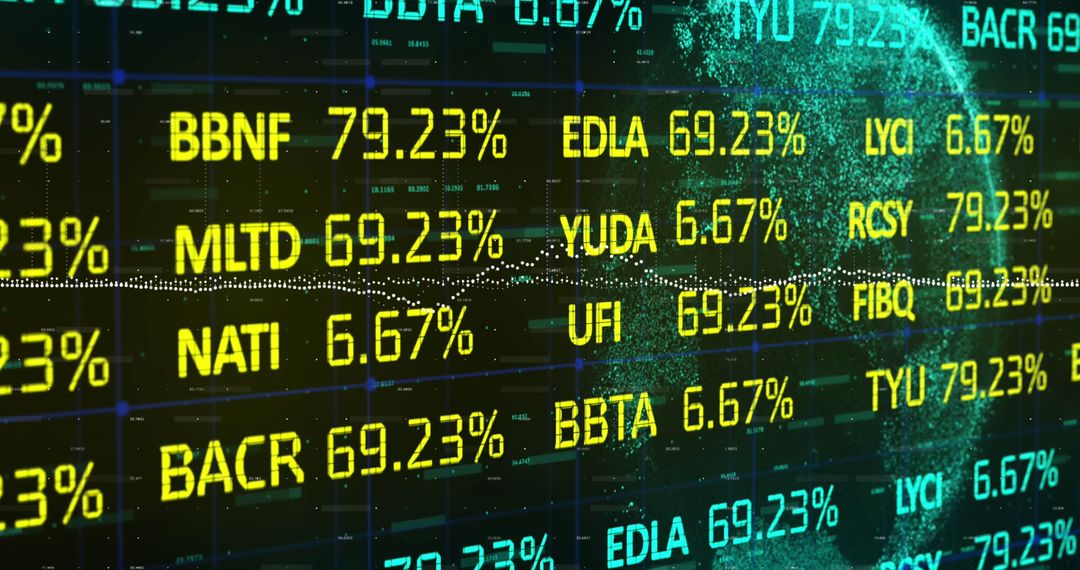
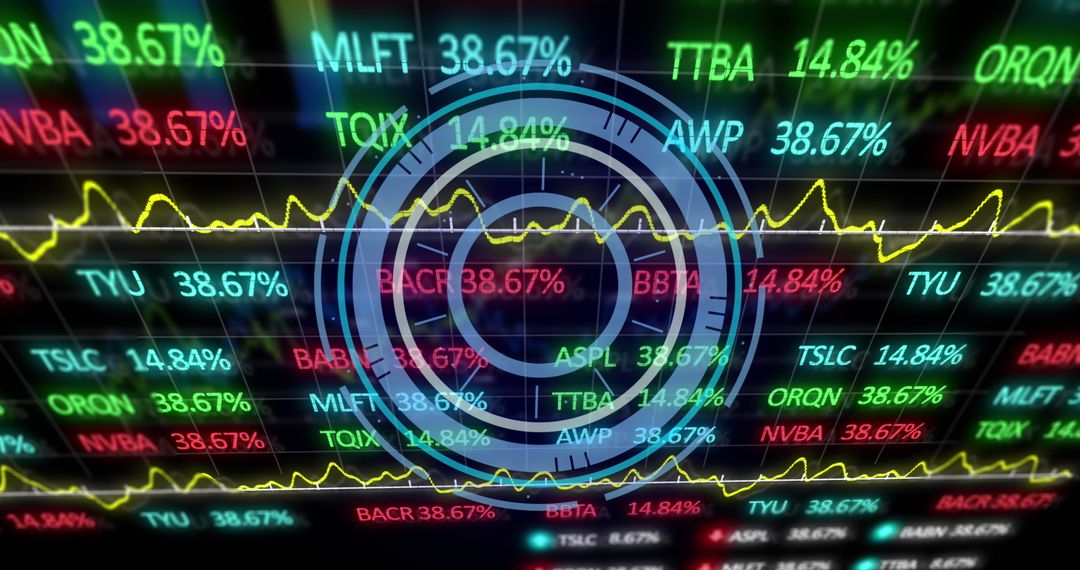
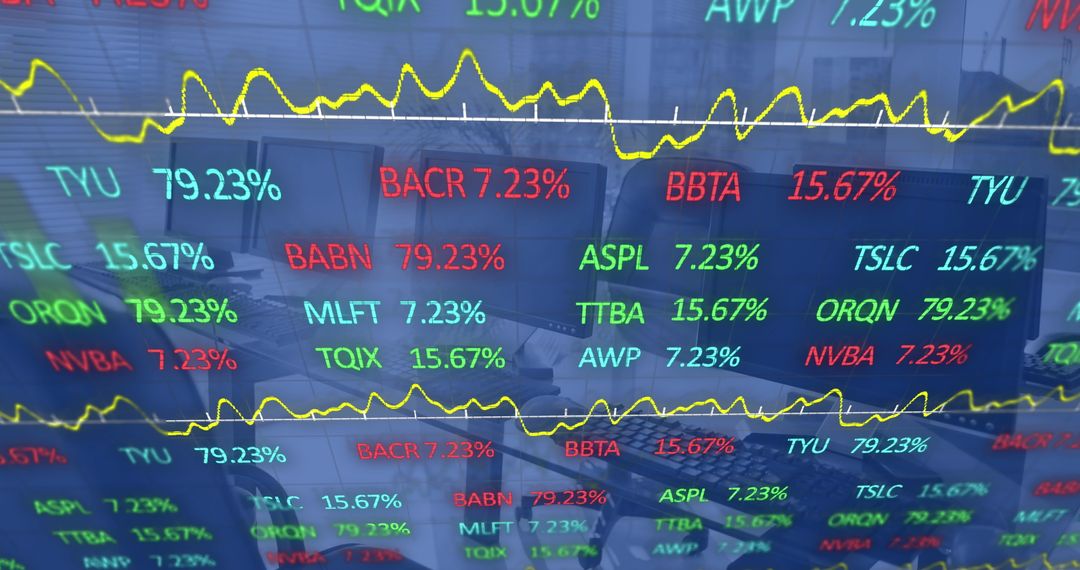
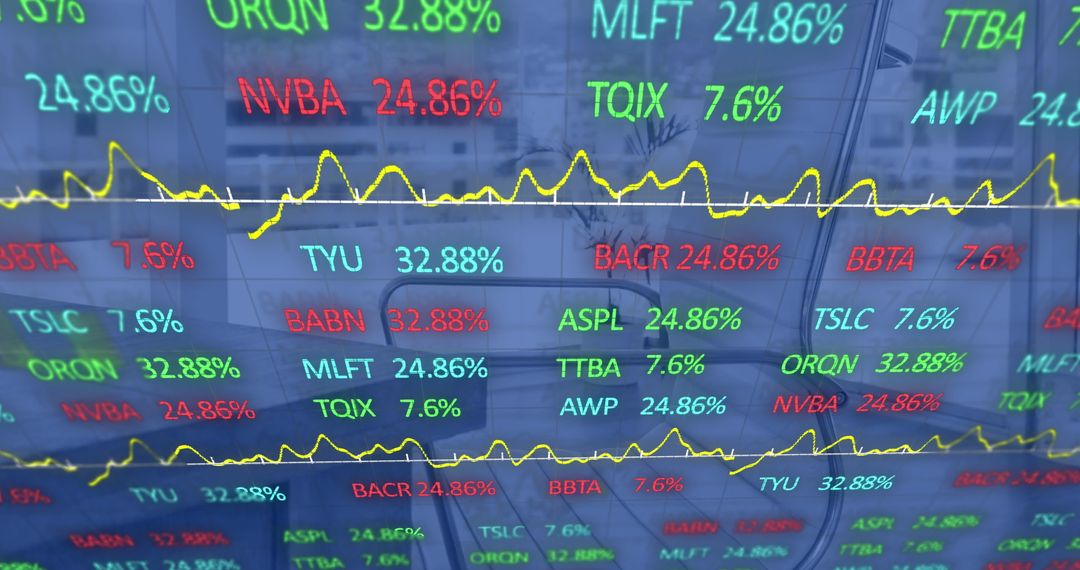
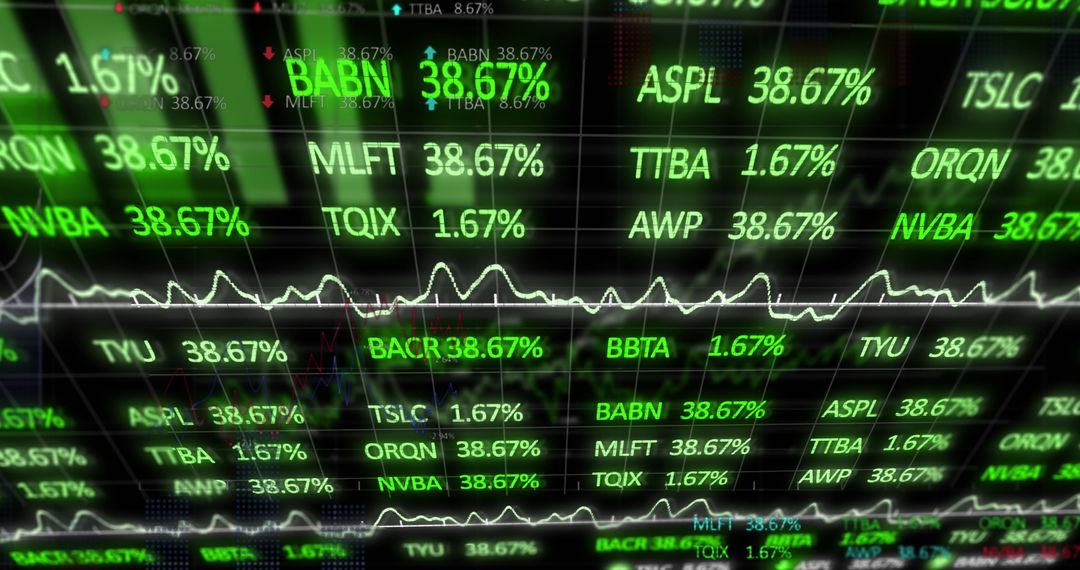
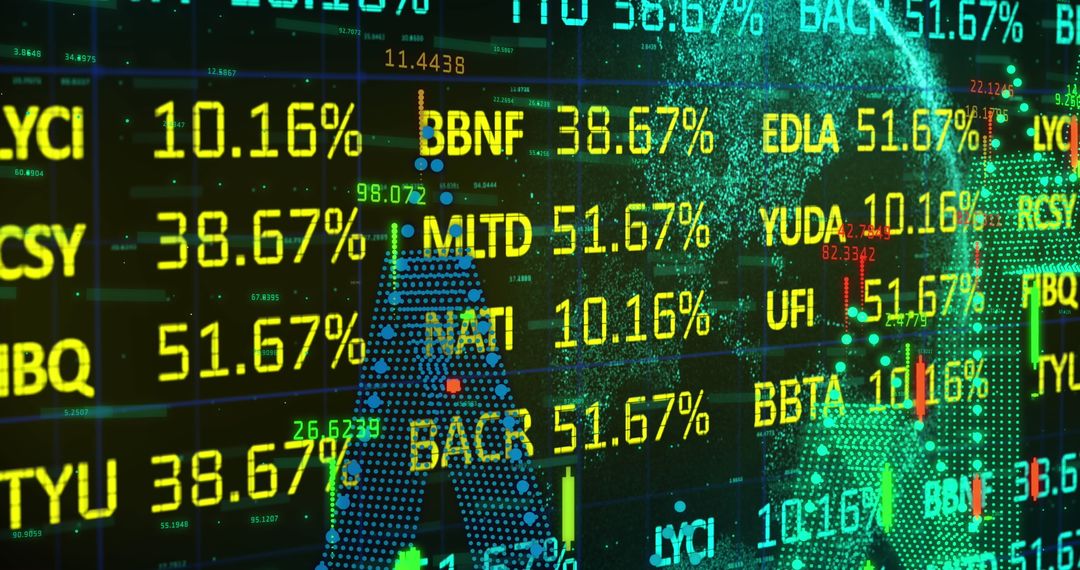
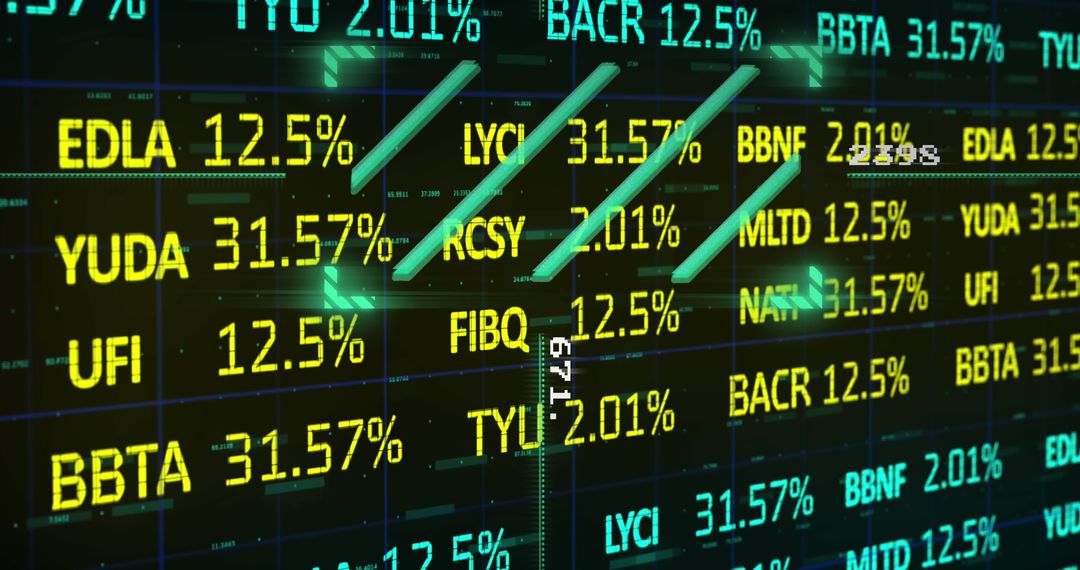
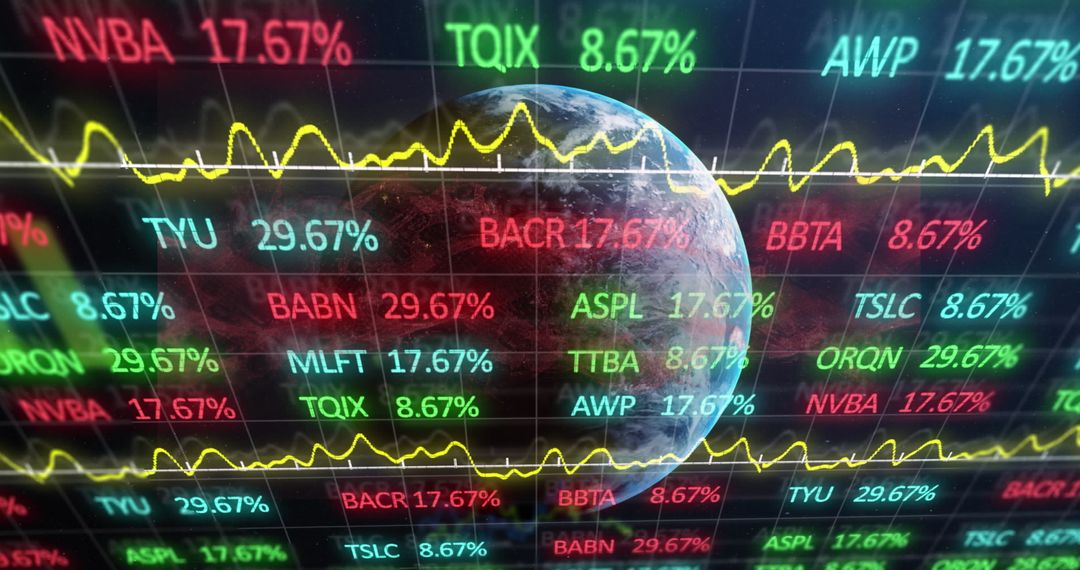
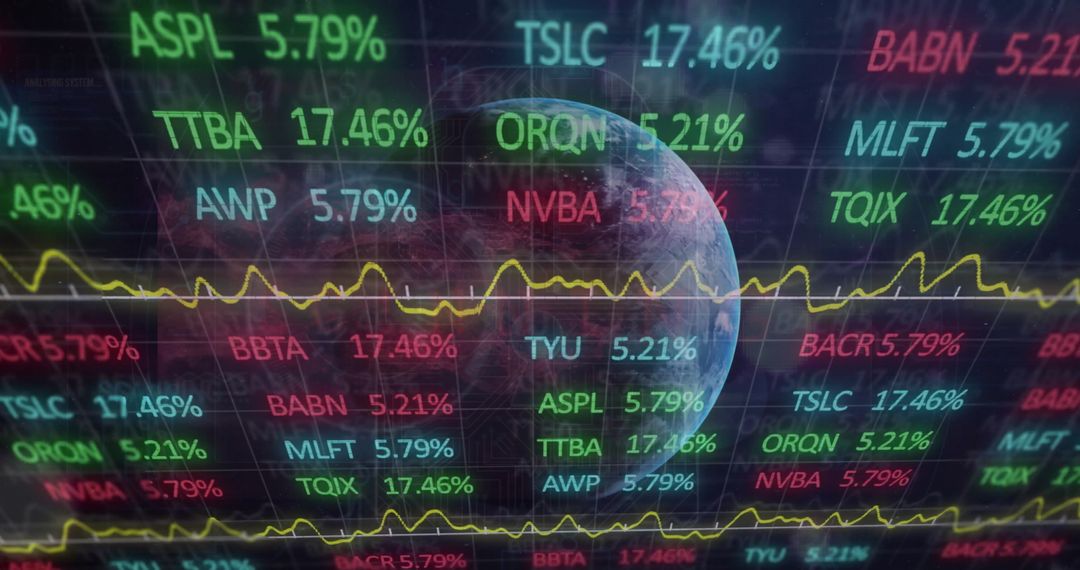
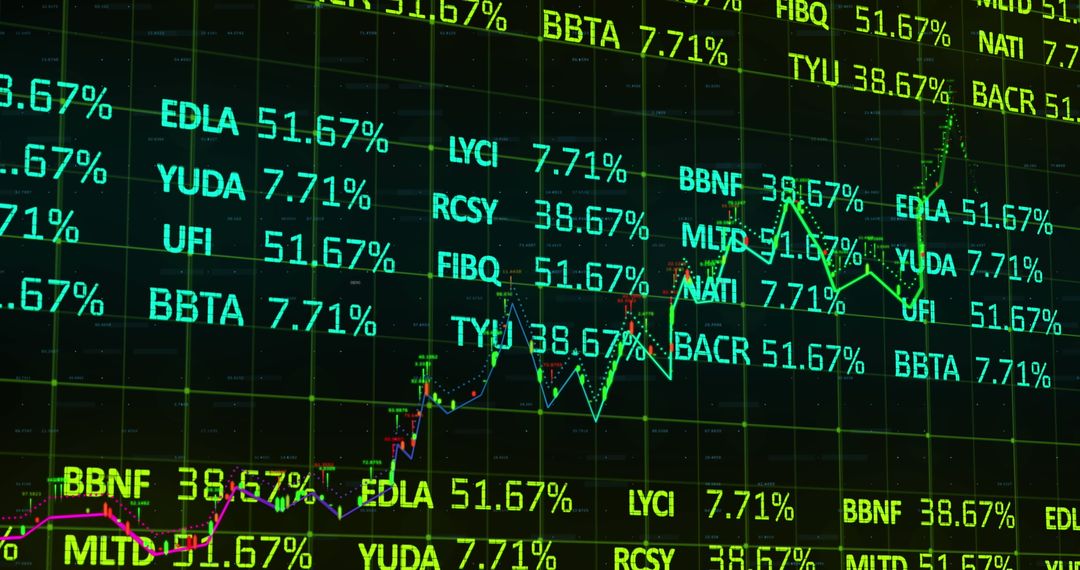
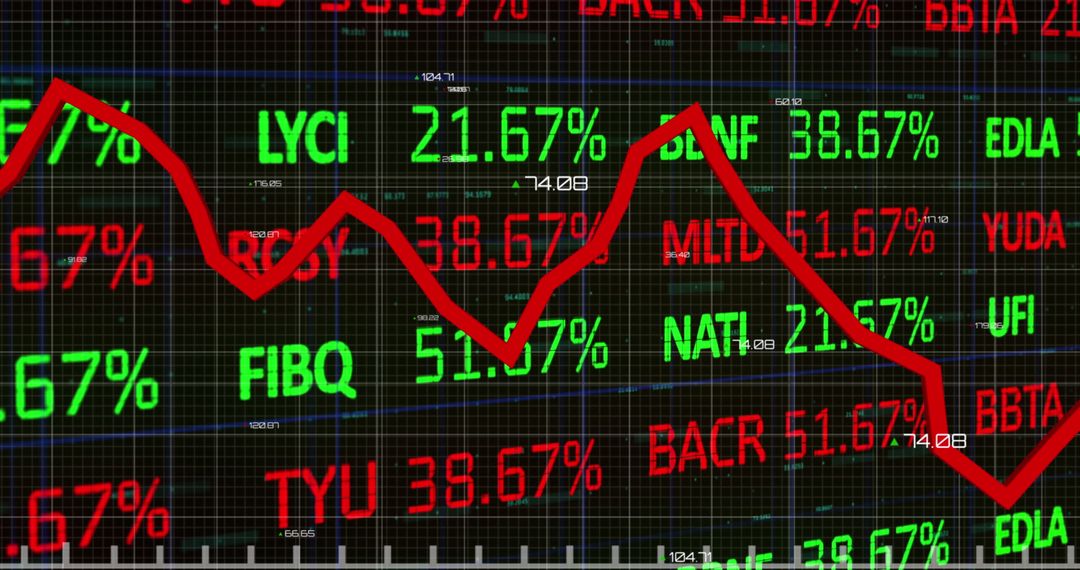
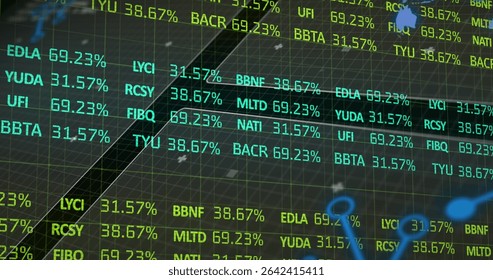
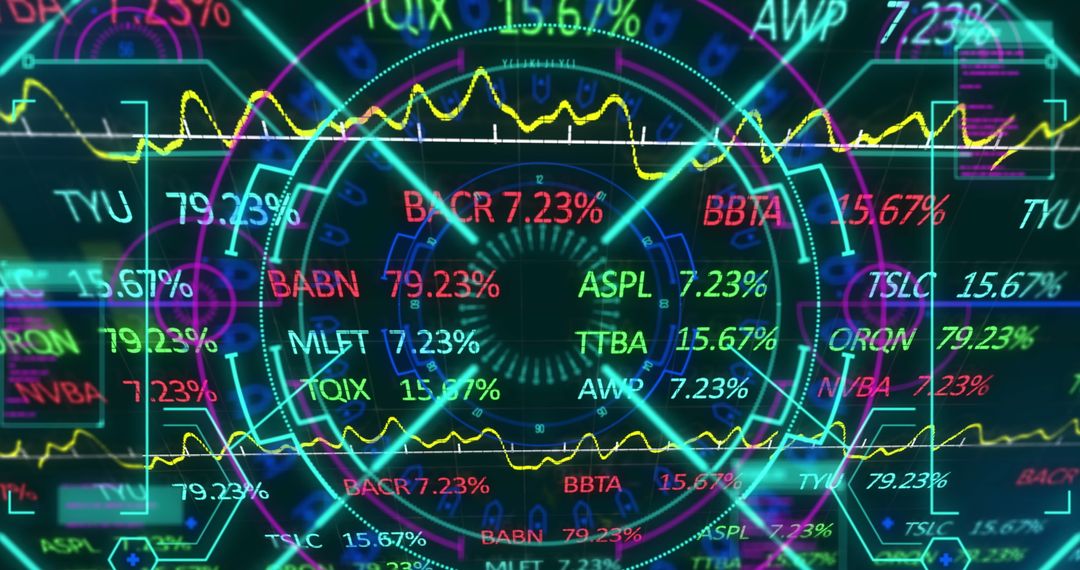
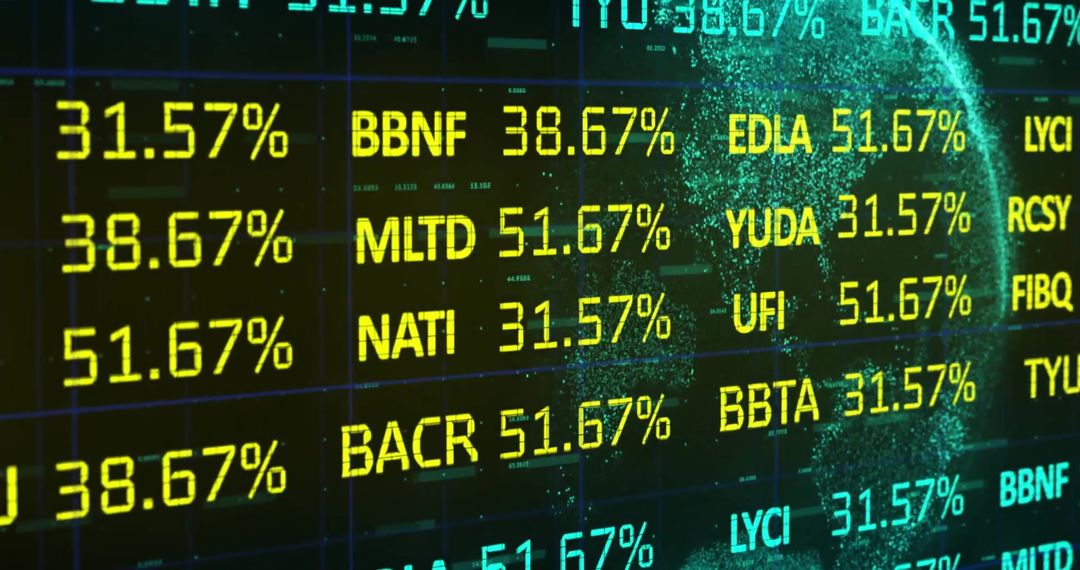
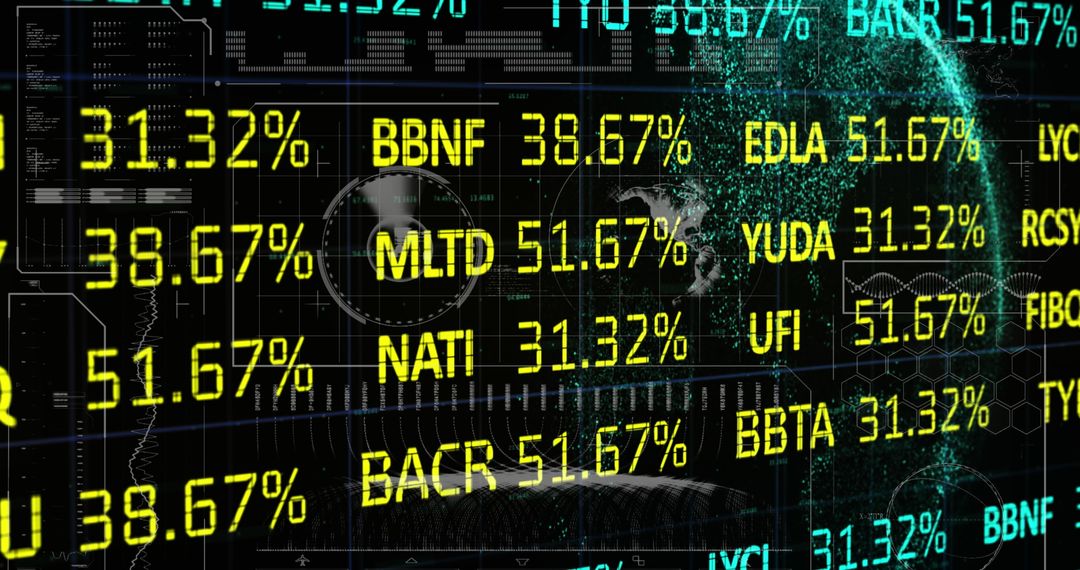
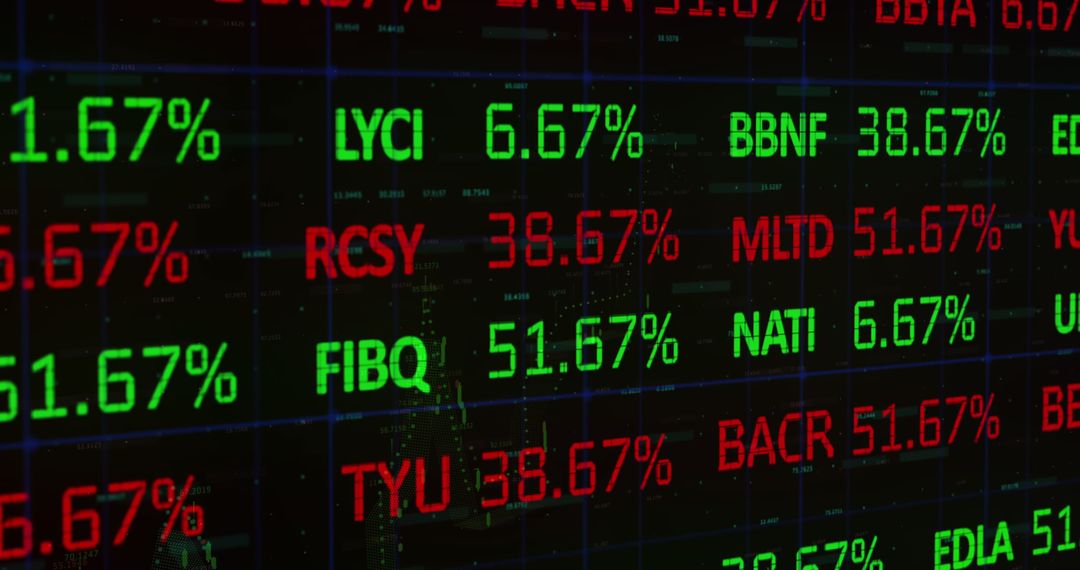
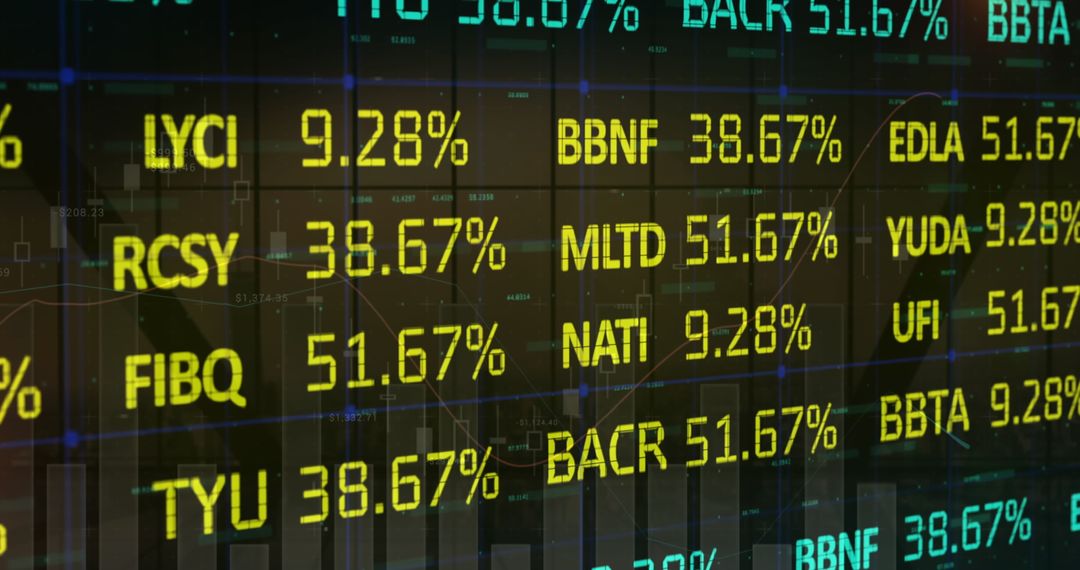
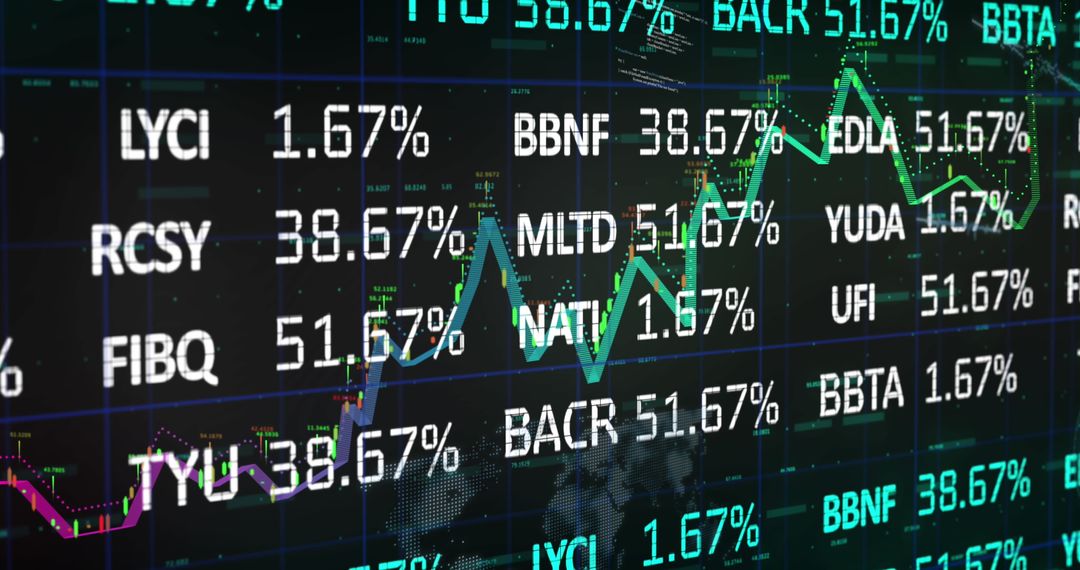
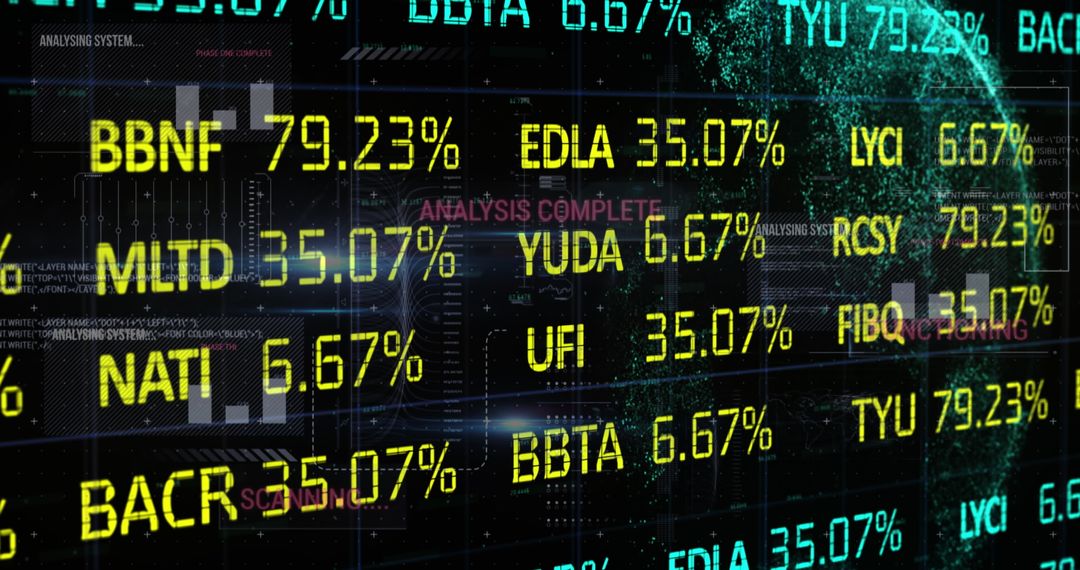
This visually engaging scene presents a futuristic holographic display of a stock market trading board overlaying global economic infographics. Ideal for concepts related to globalization, finance, market trends, investments, and technology advances. Useful for financial services marketing, technological showcases, banking products, and educational resources about digital trading platforms.
Powered by  - Get 15% off with code: PIKWIZARD15


2
downloads
downloads
Tags:
More
Credit Photo
If you would like to credit the Photo, here are some ways you can do so
Text Link
photo Link
<span class="text-link">
<span>
<a target="_blank" href=https://pikwizard.com/photo/holographic-stock-market-trading-interface-with-infographics/12c2be5f4168a488035e45d1e2ad15ff/>PikWizard</a>
</span>
</span>
<span class="image-link">
<span
style="margin: 0 0 20px 0; display: inline-block; vertical-align: middle; width: 100%;"
>
<a
target="_blank"
href="https://pikwizard.com/photo/holographic-stock-market-trading-interface-with-infographics/12c2be5f4168a488035e45d1e2ad15ff/"
style="text-decoration: none; font-size: 10px; margin: 0;"
>
<img src="https://pikwizard.com/pw/medium/12c2be5f4168a488035e45d1e2ad15ff.jpg" style="margin: 0; width: 100%;" alt="" />
<p style="font-size: 12px; margin: 0;">PikWizard</p>
</a>
</span>
</span>
Free (free of charge)
Free for personal and commercial use.
Author: People Creations
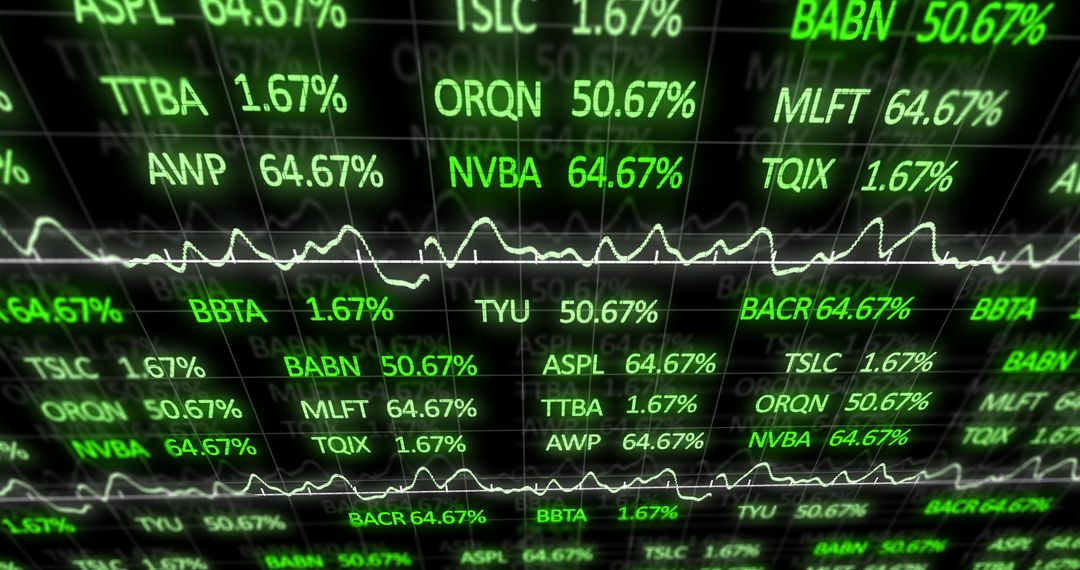
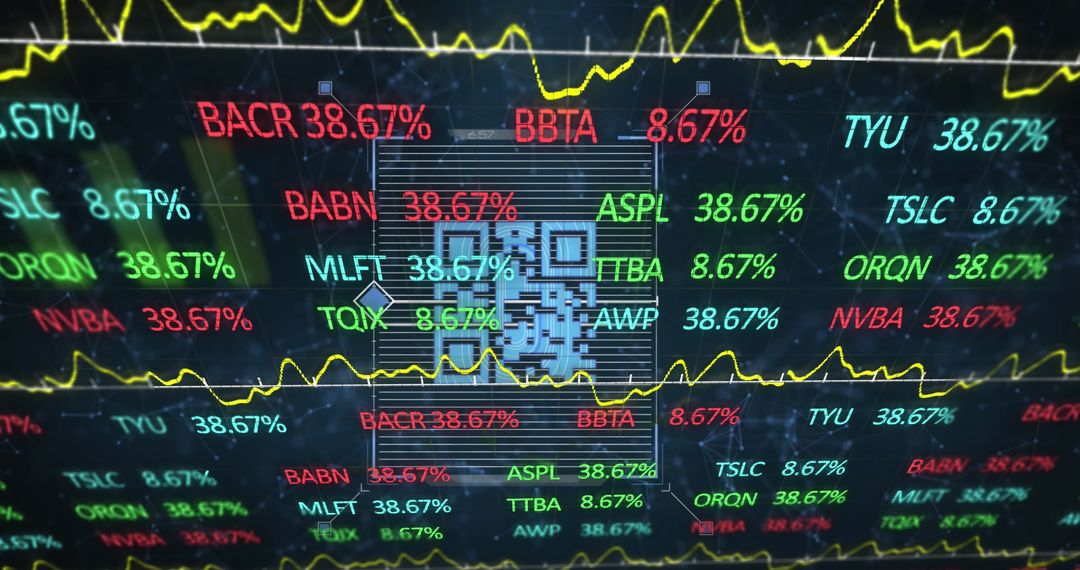
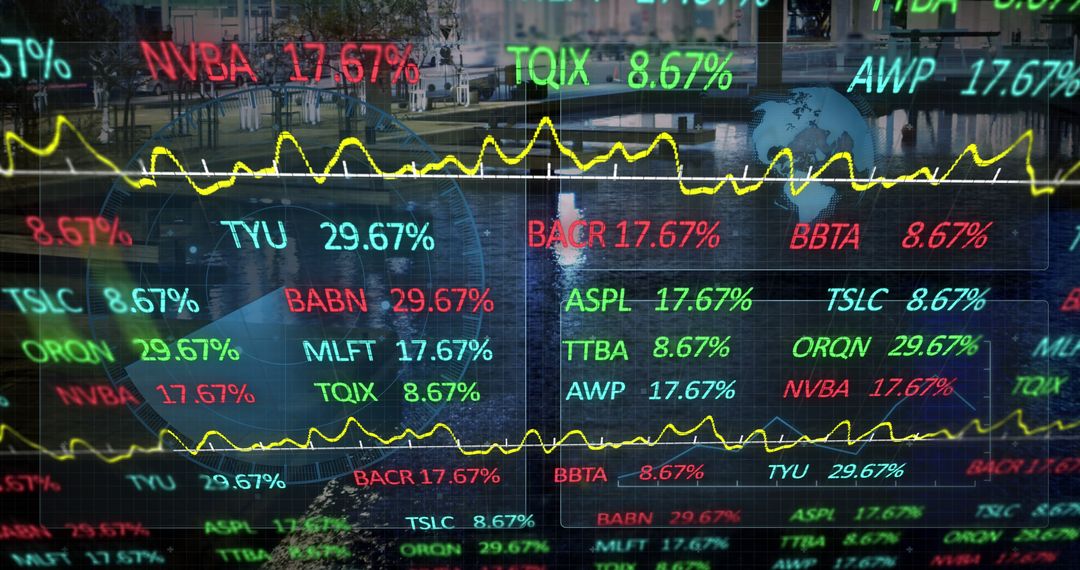
Similar Free Stock Images
Premium


Premium


Premium


Premium


Premium


Premium


Premium


Premium


Premium


Premium


Premium


Premium


Premium


Premium


Premium


Premium


Premium


Premium

Premium


Premium


Premium


Premium


Premium


Premium

