
- Home >
- Stock Photos >
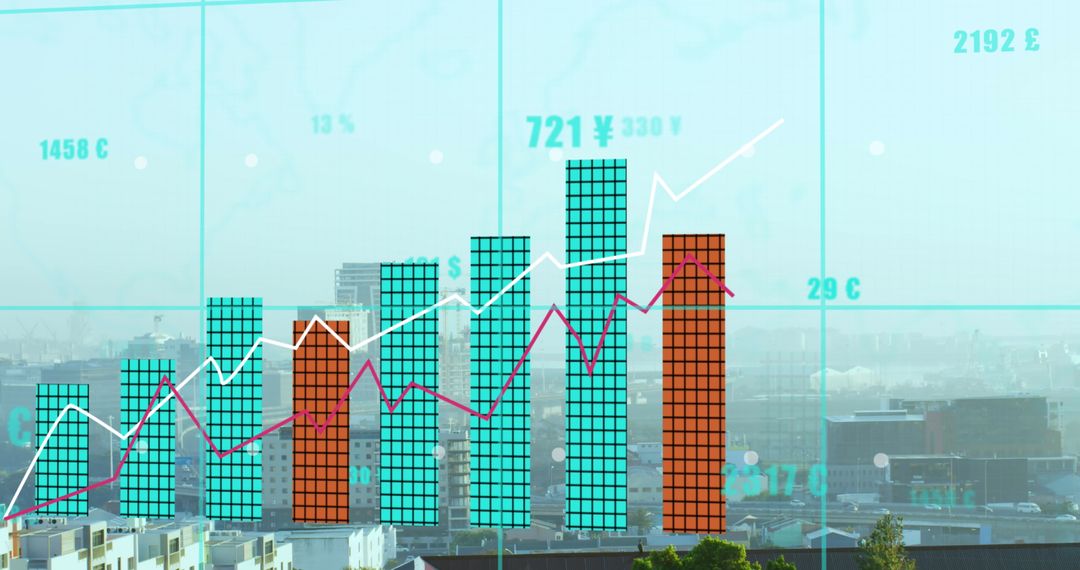
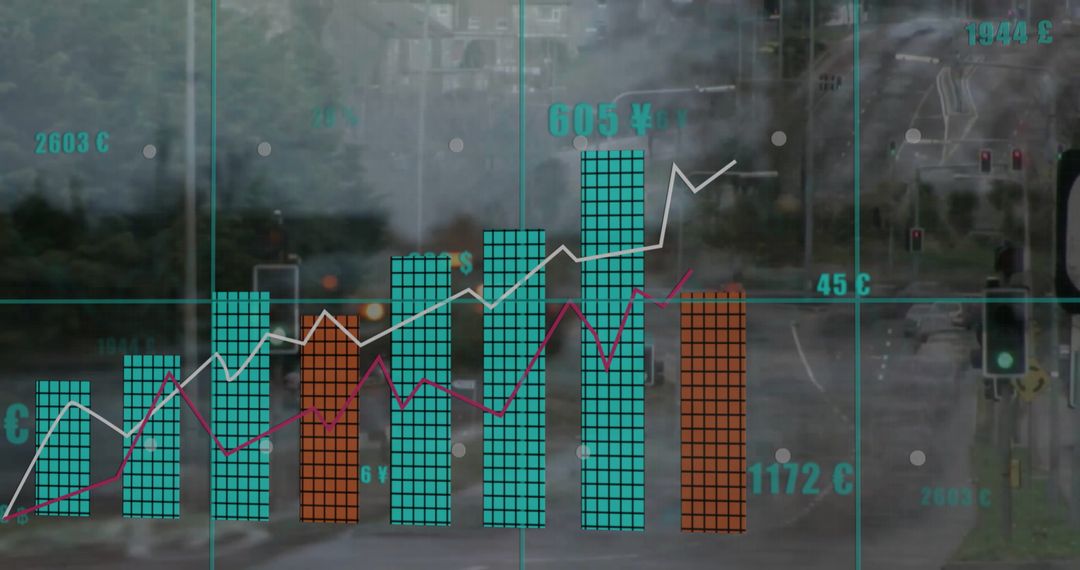
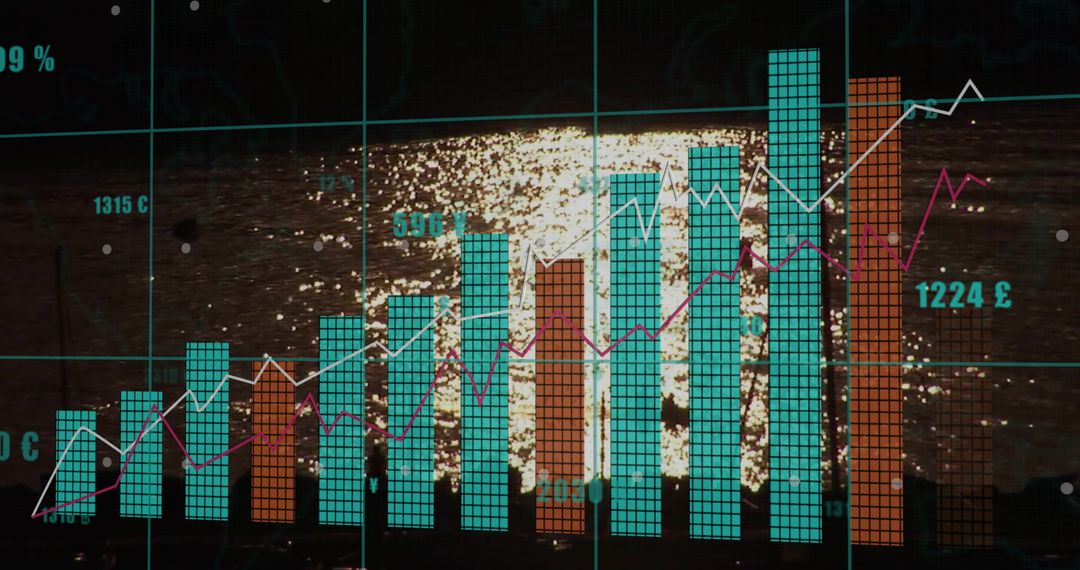
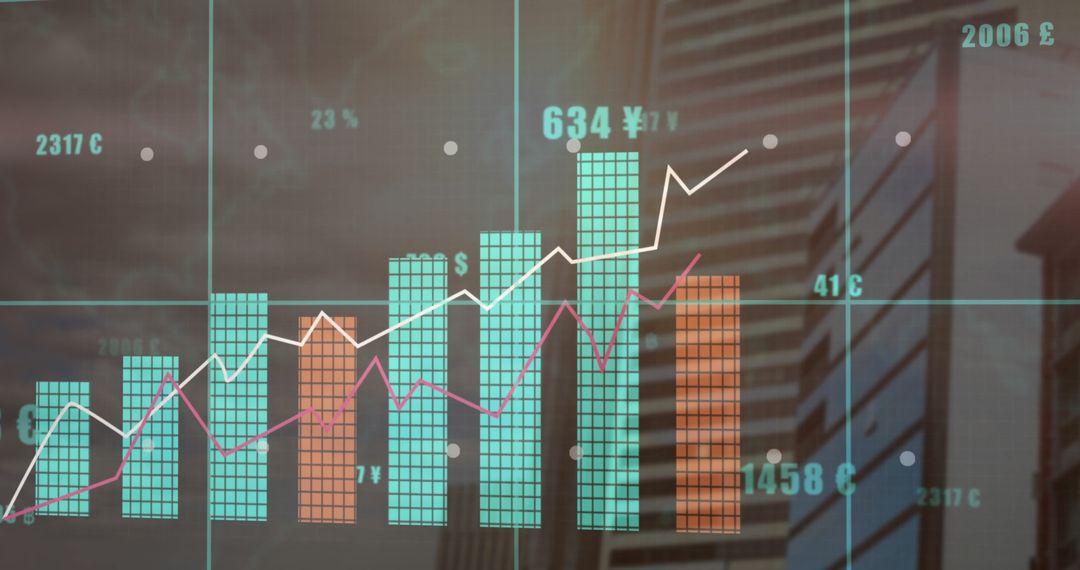
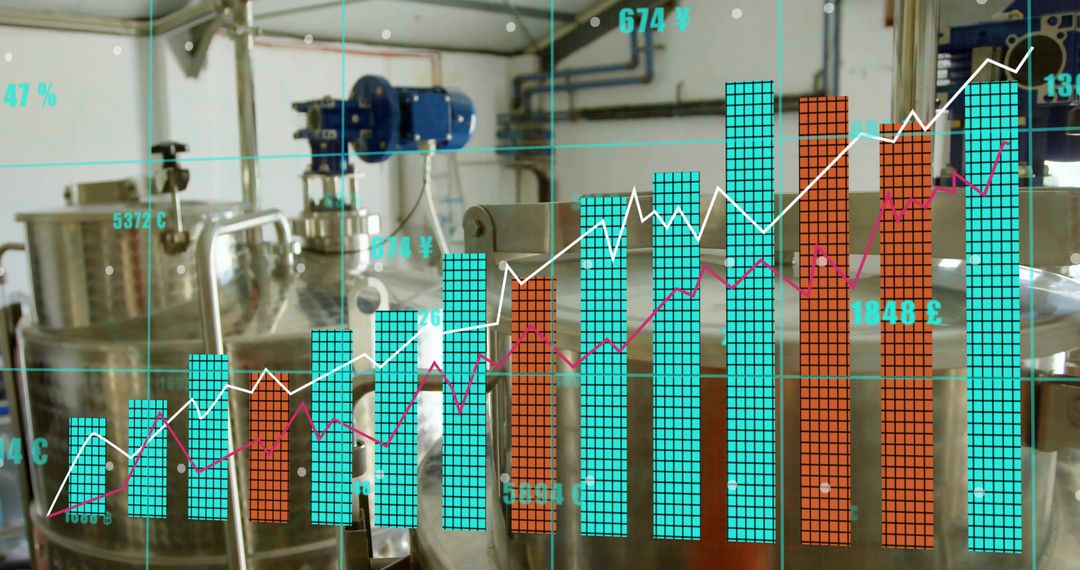
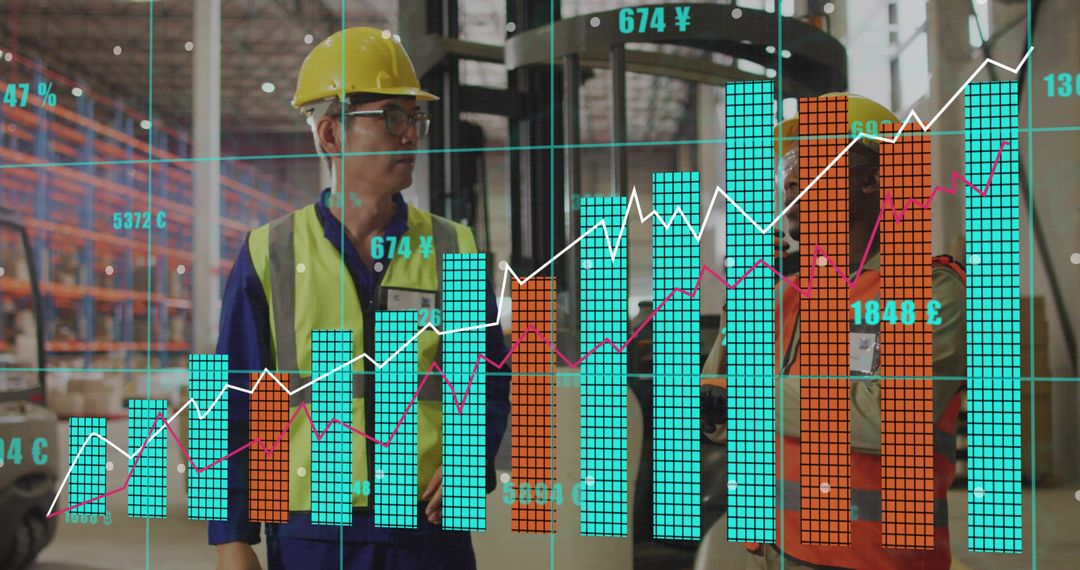
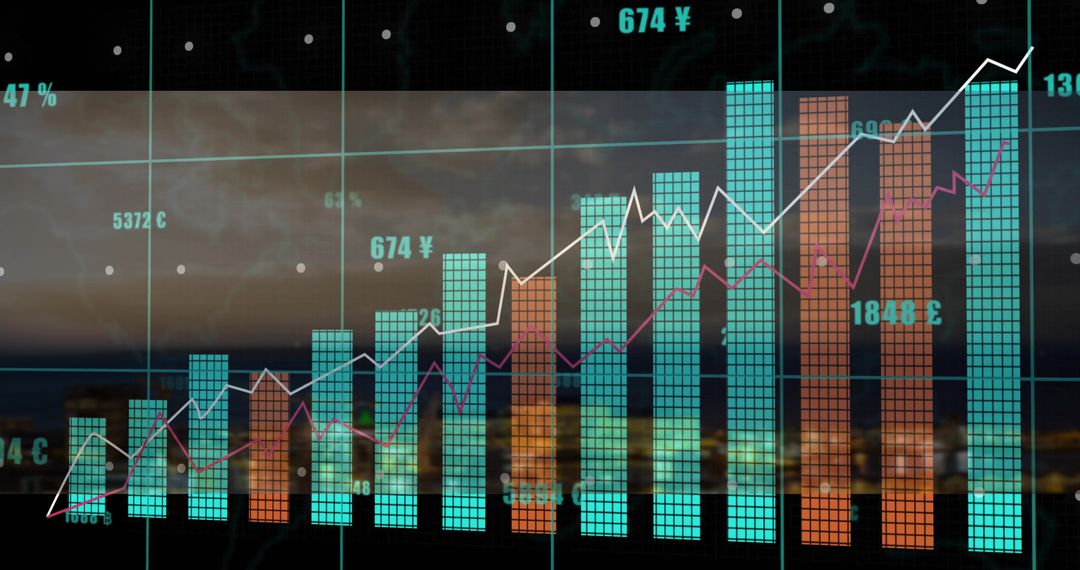
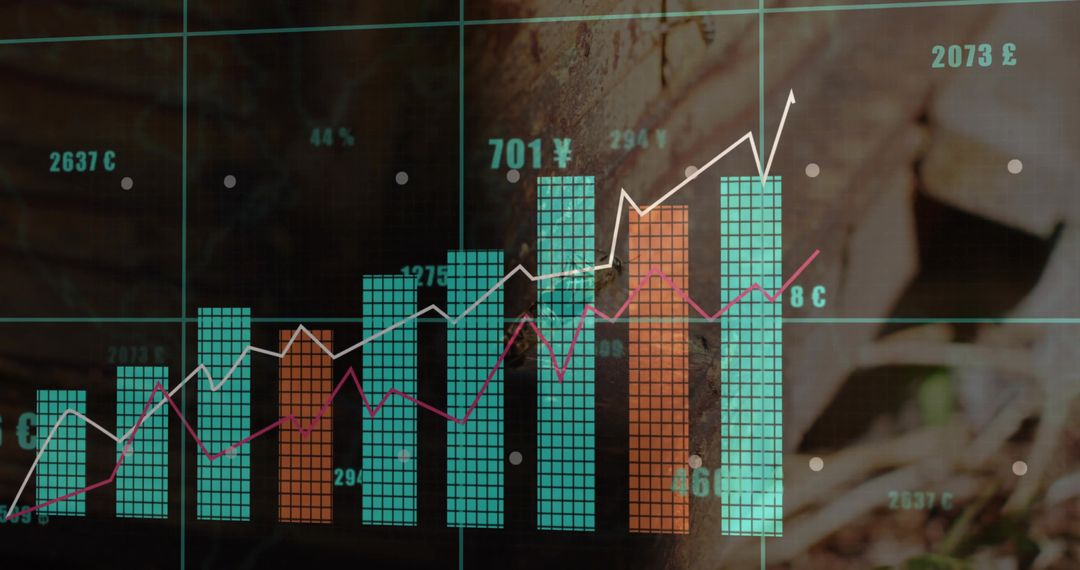
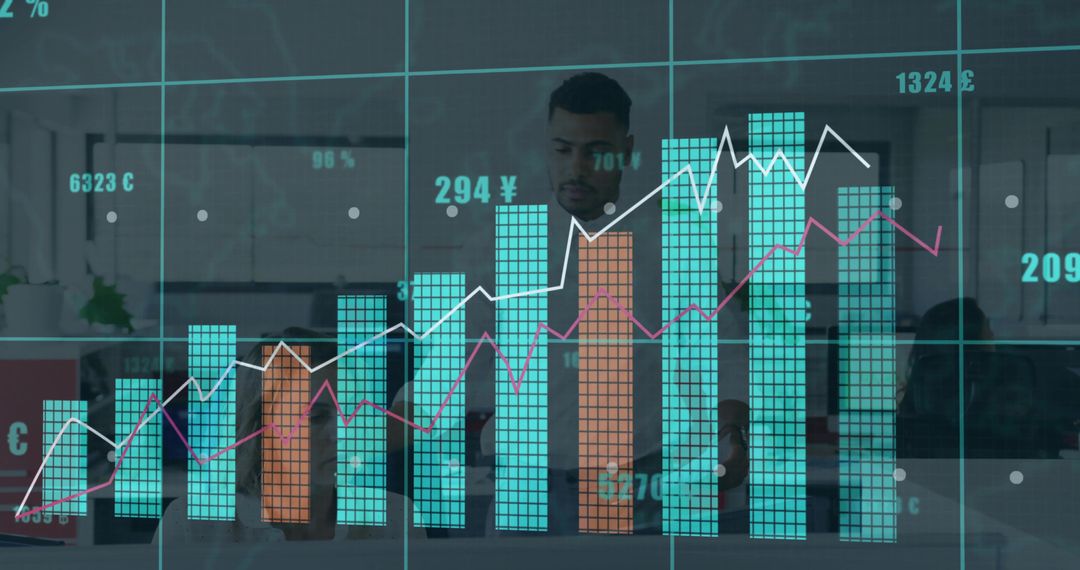
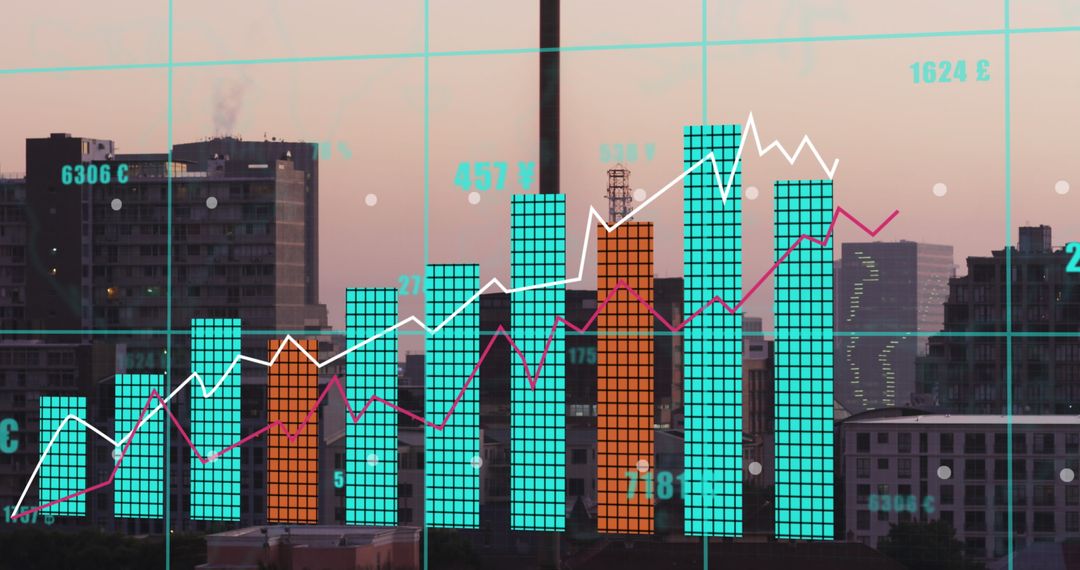
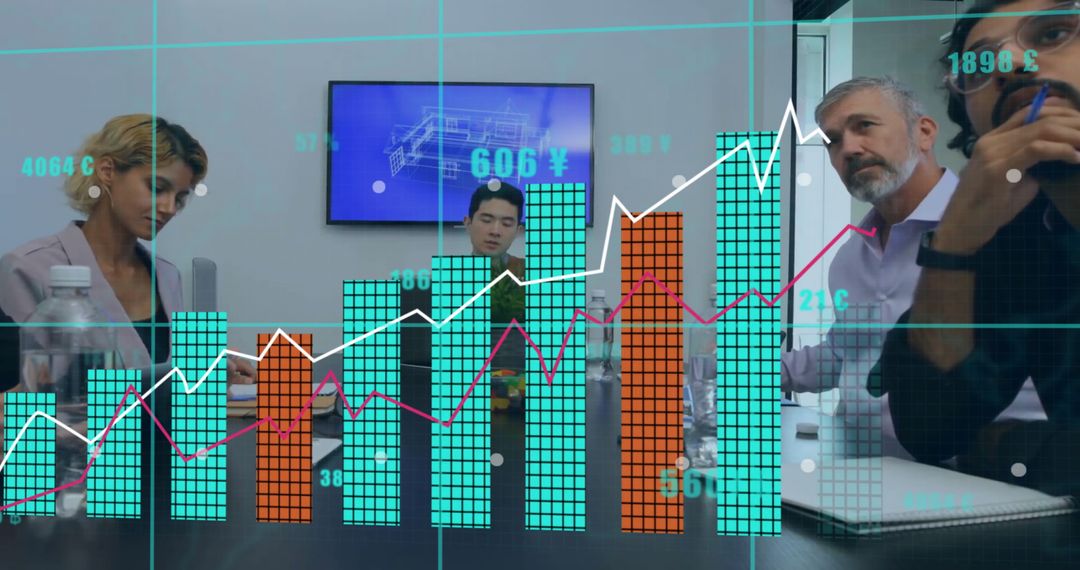
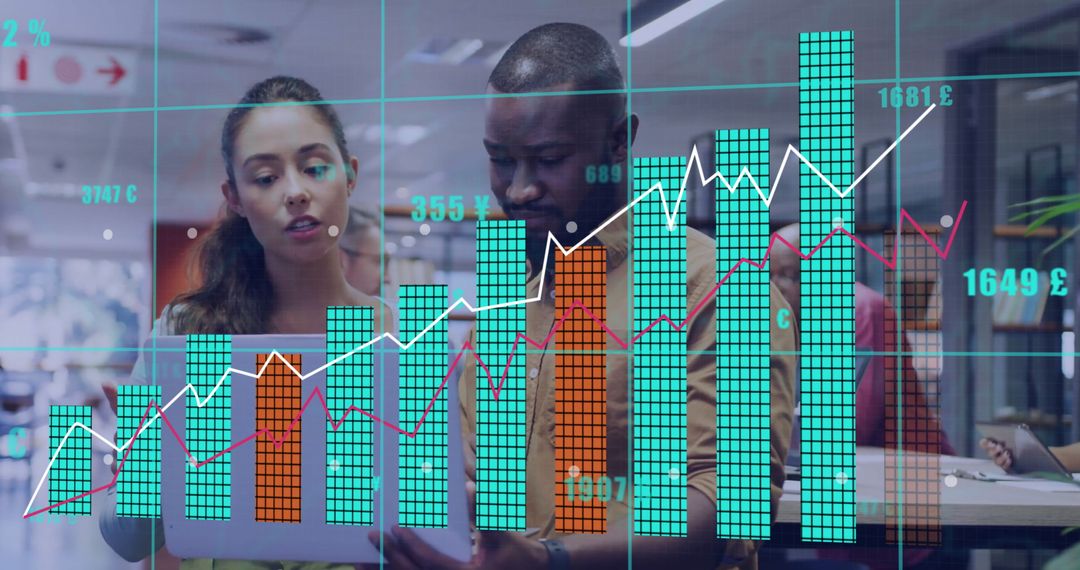
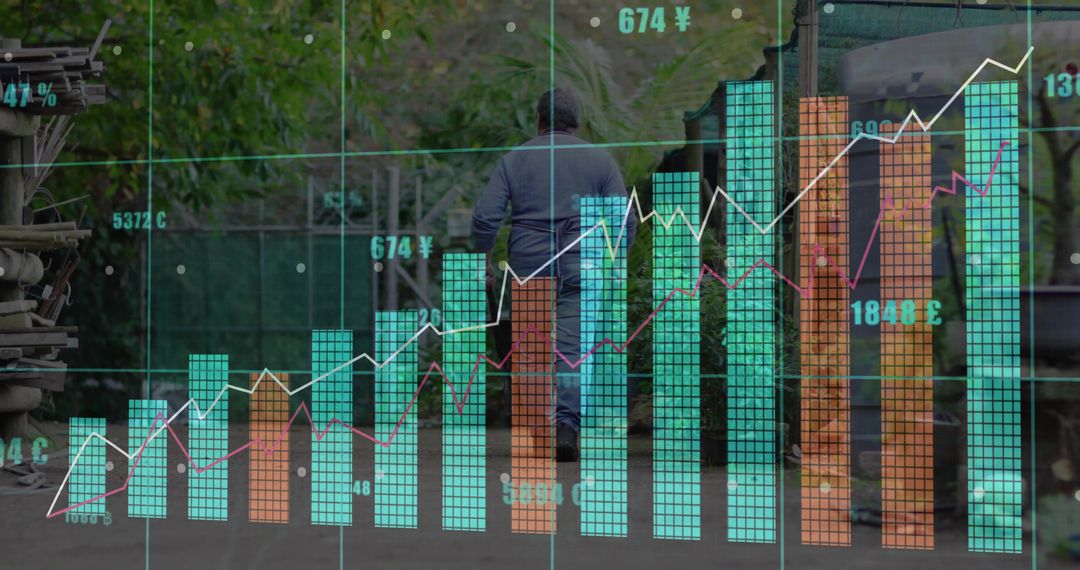
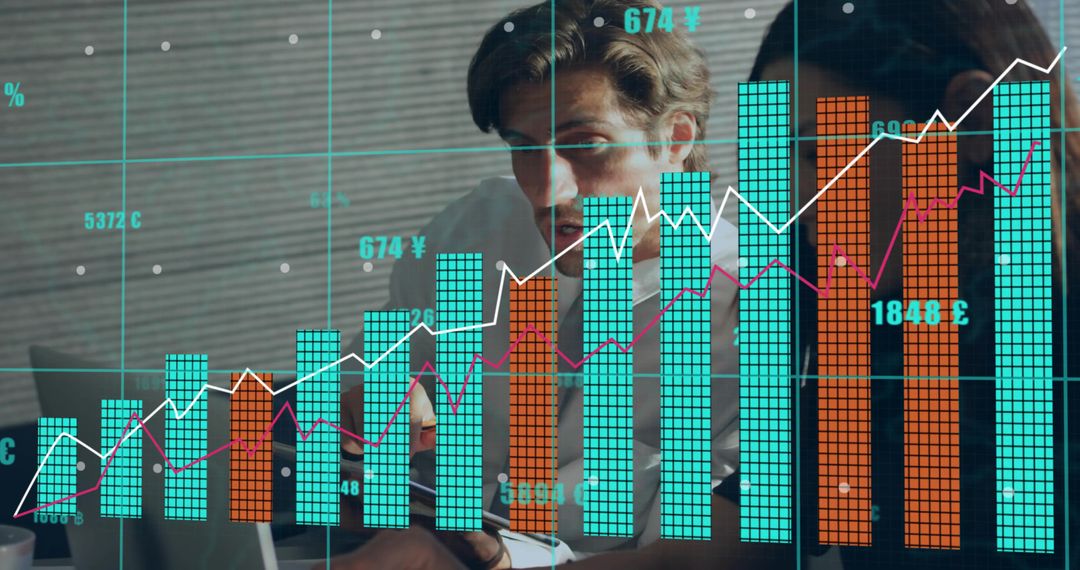
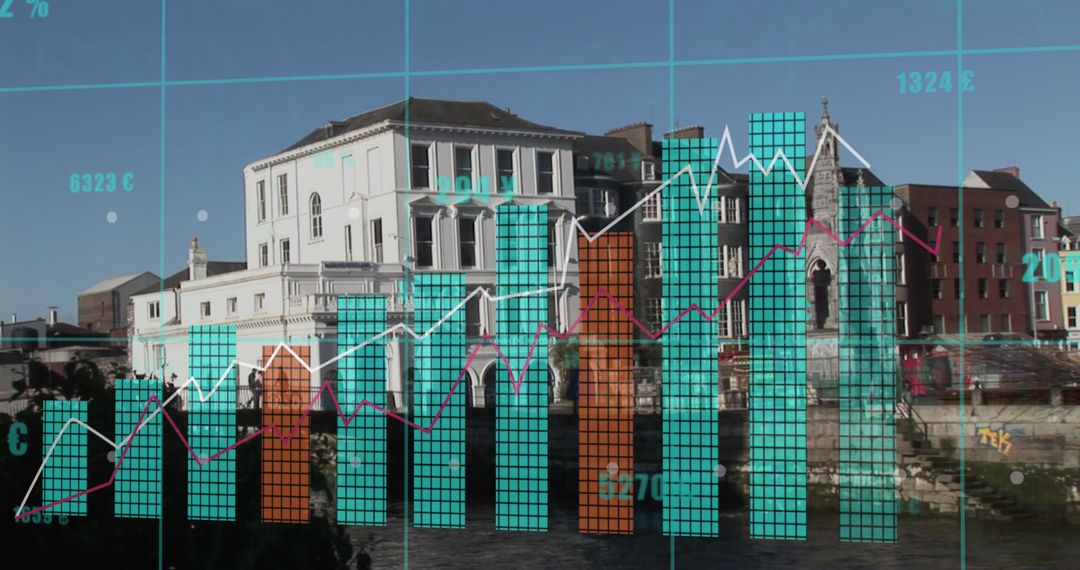
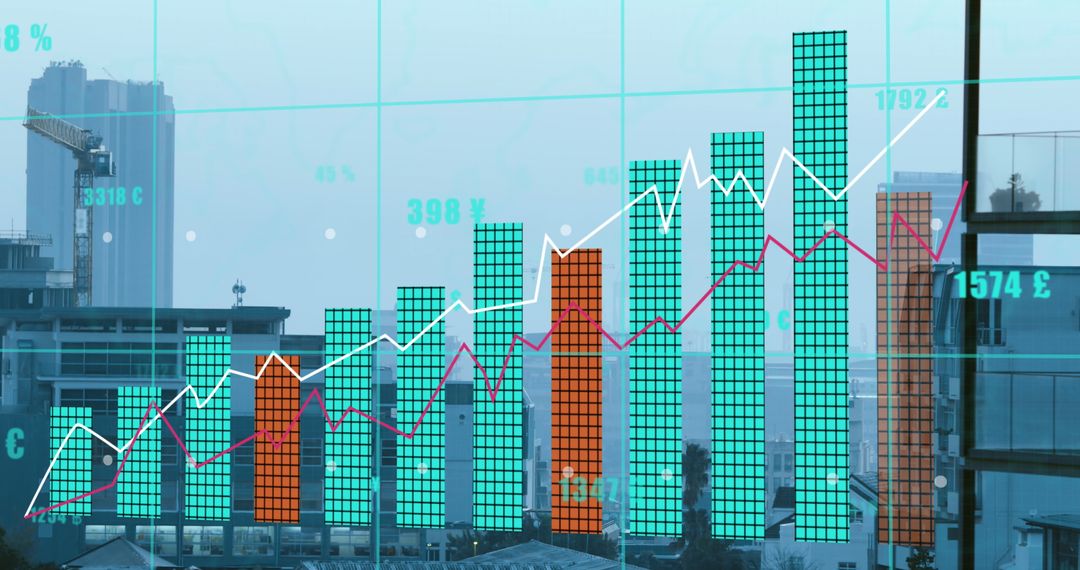
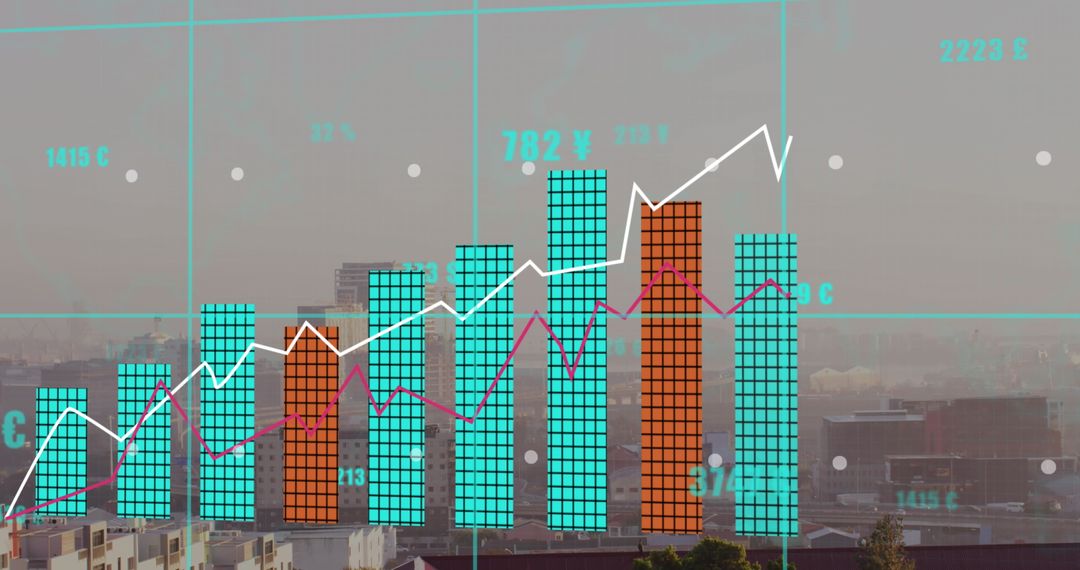
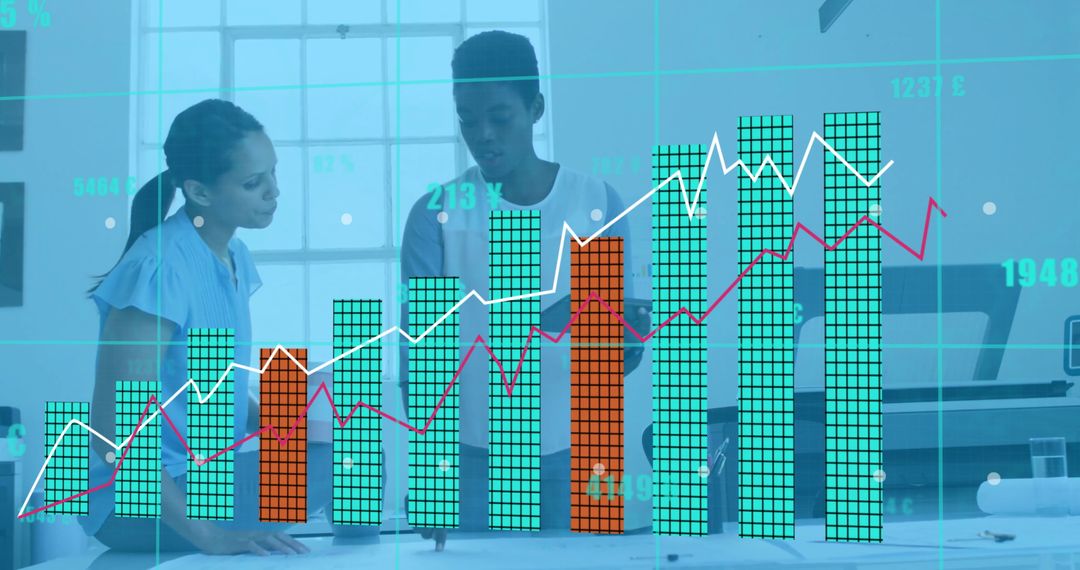
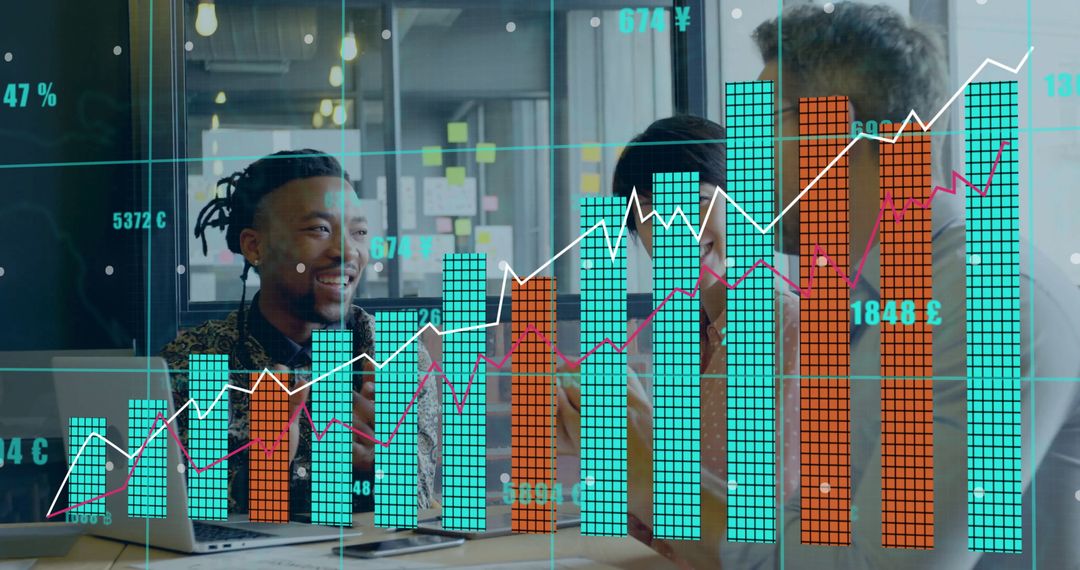
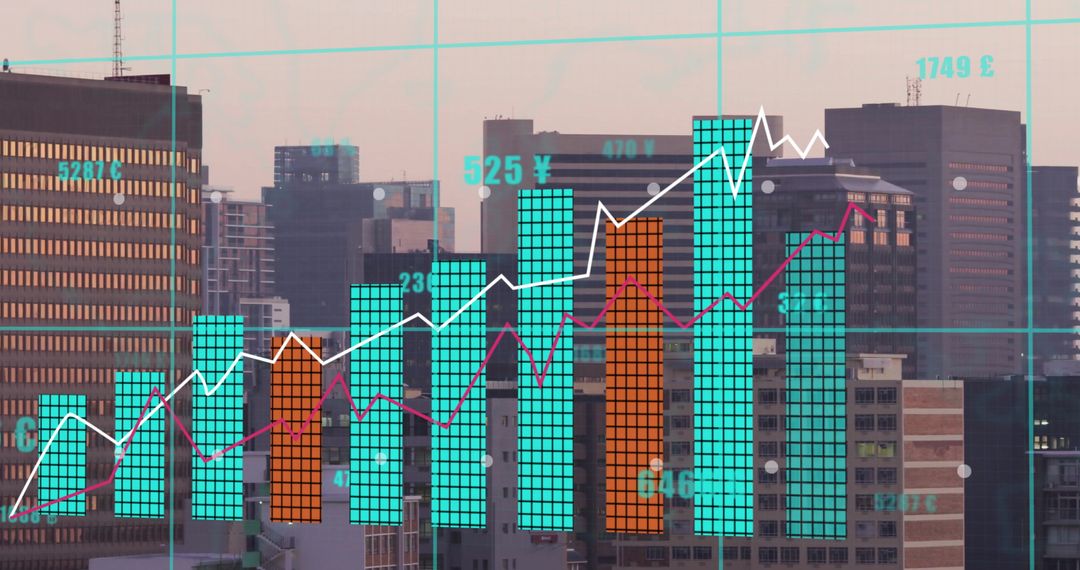
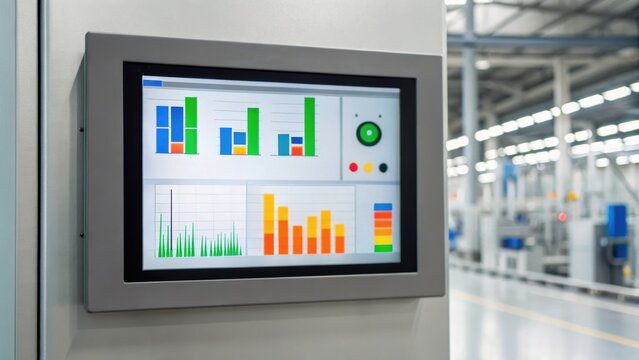
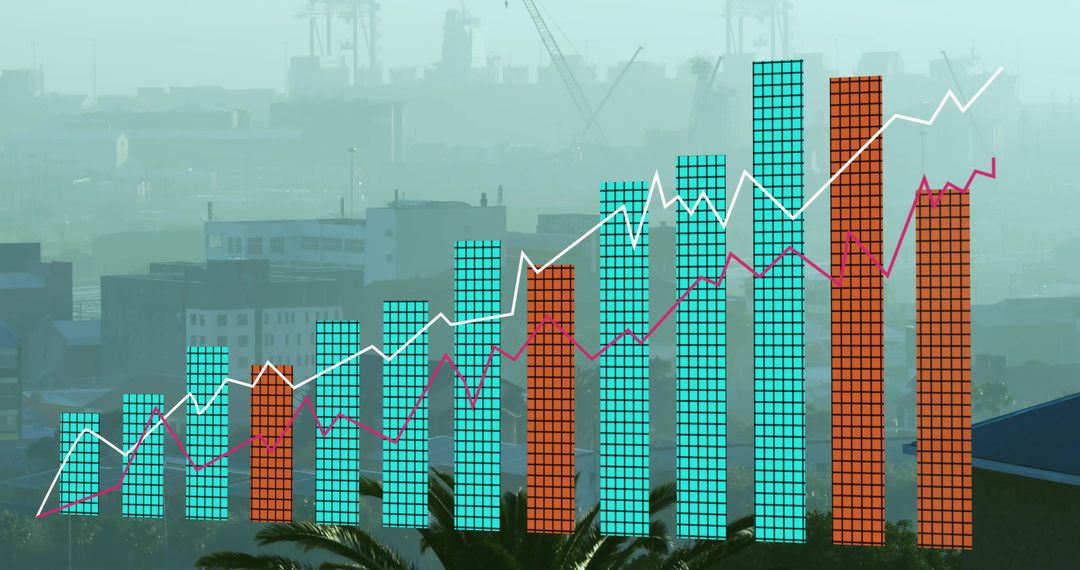
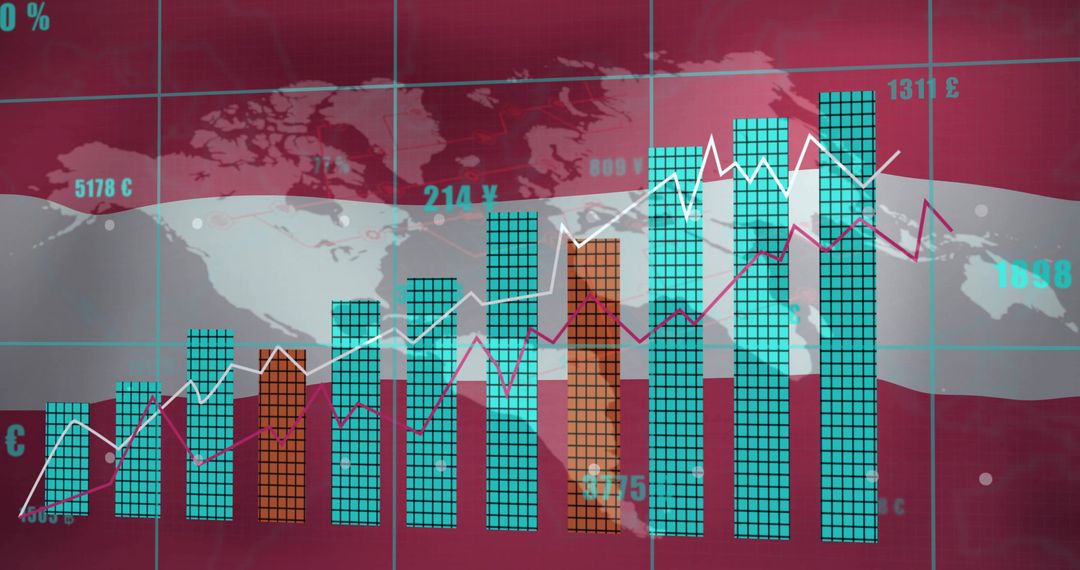
- Industrial analytics dashboard showing overlaid bar chart and trend lines on factory
Industrial analytics dashboard showing overlaid bar chart and trend lines on factory Image
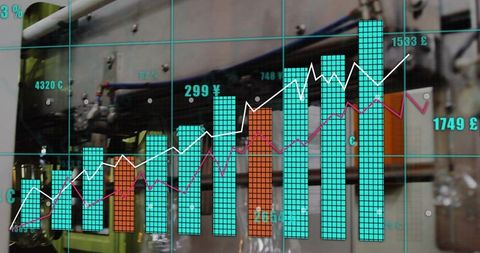
Showing overlaid turquoise and orange bar stacks with white and magenta trend lines against blurred factory machinery. Featuring grid overlay, currency labels (¥, £), and small data nodes for high-tech analytics look. Providing clean visual contrast between physical production and digital metrics for manufacturing communications. Ideal for presentations, websites, corporate reports, investor decks, blog posts, and social media promoting Industry 4.0, IoT, factory automation, or performance analytics. Supporting use as header graphics for technology pages, slide backgrounds for KPI reviews, visuals for annual reports, and marketing materials for analytics software. Editable overlay options recommended for customizing colors, labels, and KPI values to match brand. High-resolution composition working well for print, web, and video projects.
Powered by 


0
downloads
downloads
Tags:
More
Credit Photo
If you would like to credit the Photo, here are some ways you can do so
Text Link
photo Link
<span class="text-link">
<span>
<a target="_blank" href=https://pikwizard.com/photo/industrial-analytics-dashboard-showing-overlaid-bar-chart-and-trend-lines-on-factory/b2135cb2491dd006a8fcb52a191dab88/>PikWizard</a>
</span>
</span>
<span class="image-link">
<span
style="margin: 0 0 20px 0; display: inline-block; vertical-align: middle; width: 100%;"
>
<a
target="_blank"
href="https://pikwizard.com/photo/industrial-analytics-dashboard-showing-overlaid-bar-chart-and-trend-lines-on-factory/b2135cb2491dd006a8fcb52a191dab88/"
style="text-decoration: none; font-size: 10px; margin: 0;"
>
<img src="https://pikwizard.com/pw/medium/b2135cb2491dd006a8fcb52a191dab88.jpg" style="margin: 0; width: 100%;" alt="" />
<p style="font-size: 12px; margin: 0;">PikWizard</p>
</a>
</span>
</span>
Free (free of charge)
Free for personal and commercial use.
Author: Awesome Content
Similar Free Stock Images

Premium


Premium


Premium


Premium


Premium


Premium


Premium


Premium


Premium


Premium


Premium


Premium


Premium


Premium


Premium


Premium


Premium


Premium


Premium


Premium

Premium


Premium


Premium


Premium

