- Home >
- Stock Photos >
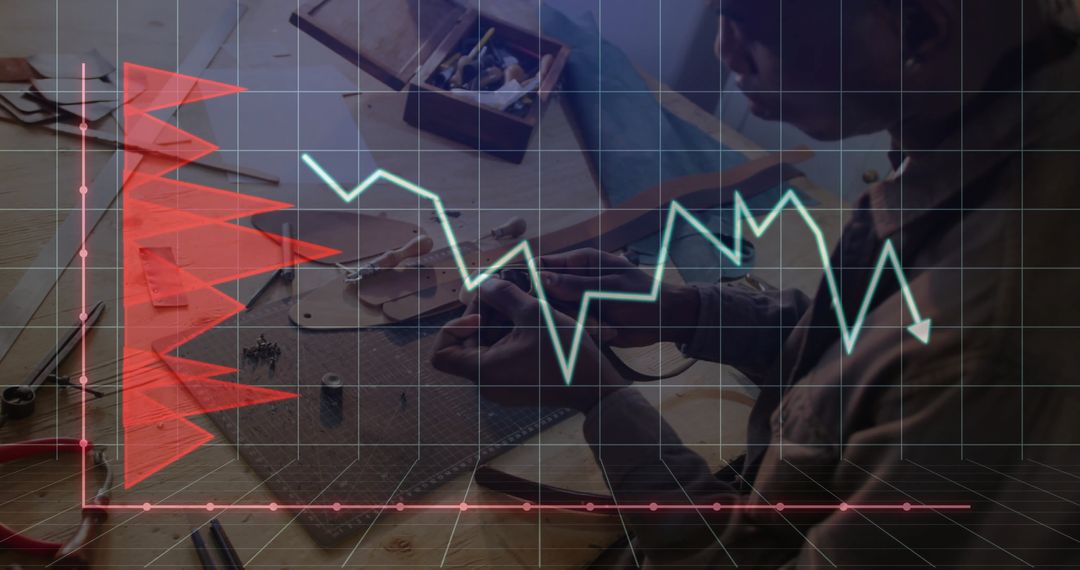
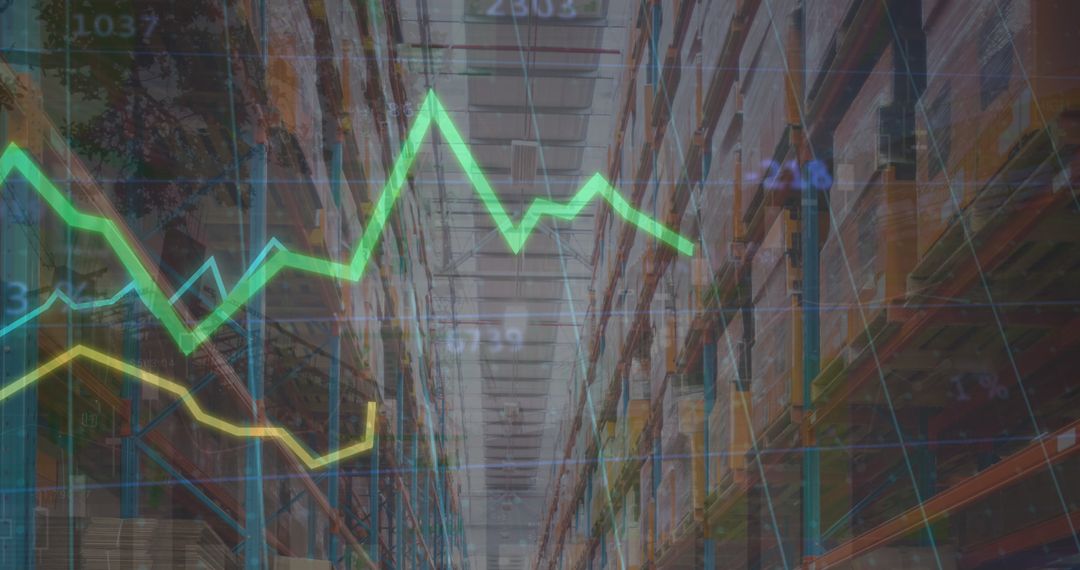
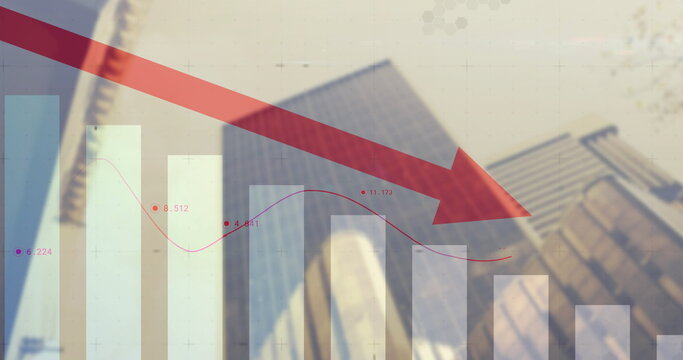
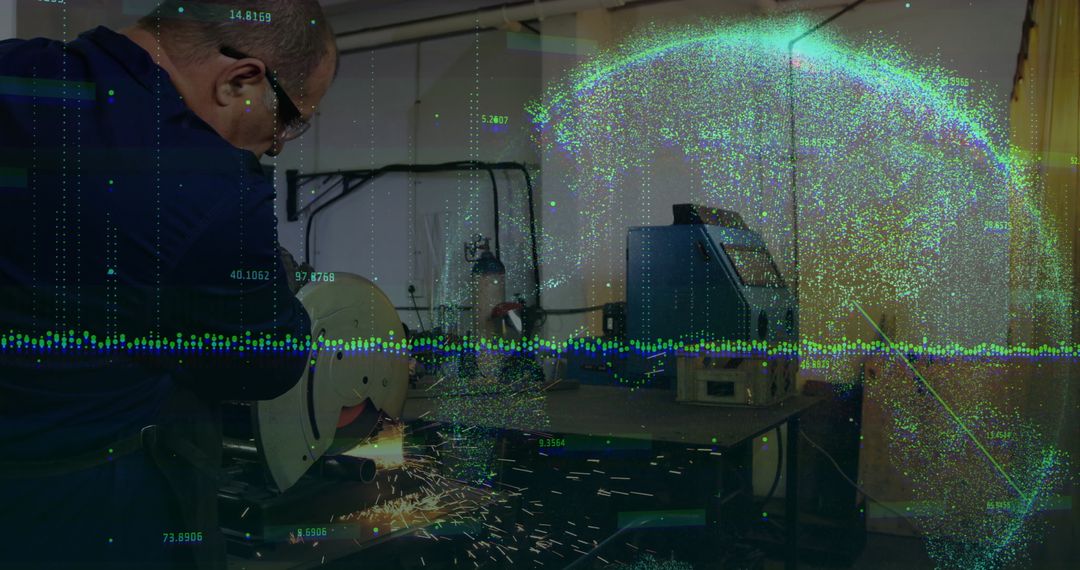
- Industrial Background with Red Bar and Green Line Graph
Industrial Background with Red Bar and Green Line Graph Image
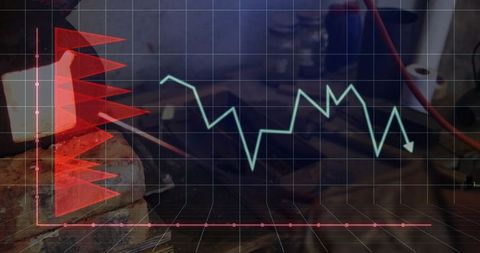
Visual combines industrial scene with bar and line graphs representing data analysis. Useful for illustrating concepts of industry, analytics, or financial tracking in technical or business projects.
Powered by 


0
downloads
downloads
Tags:
More
Credit Photo
If you would like to credit the Photo, here are some ways you can do so
Text Link
photo Link
<span class="text-link">
<span>
<a target="_blank" href=https://pikwizard.com/photo/industrial-background-with-red-bar-and-green-line-graph/4ef5446a124fc27062d439624b6944b4/>PikWizard</a>
</span>
</span>
<span class="image-link">
<span
style="margin: 0 0 20px 0; display: inline-block; vertical-align: middle; width: 100%;"
>
<a
target="_blank"
href="https://pikwizard.com/photo/industrial-background-with-red-bar-and-green-line-graph/4ef5446a124fc27062d439624b6944b4/"
style="text-decoration: none; font-size: 10px; margin: 0;"
>
<img src="https://pikwizard.com/pw/medium/4ef5446a124fc27062d439624b6944b4.jpg" style="margin: 0; width: 100%;" alt="" />
<p style="font-size: 12px; margin: 0;">PikWizard</p>
</a>
</span>
</span>
Free (free of charge)
Free for personal and commercial use.
Author: Authentic Images
Similar Free Stock Images

Premium


Premium


Premium


Premium


Premium


Premium


Premium


Premium


Premium


Premium


Premium


Premium


Premium


Premium


Premium


Premium


Premium


Premium


Premium


Premium


Premium


Premium


Premium


Premium