
- Home >
- Stock Photos >
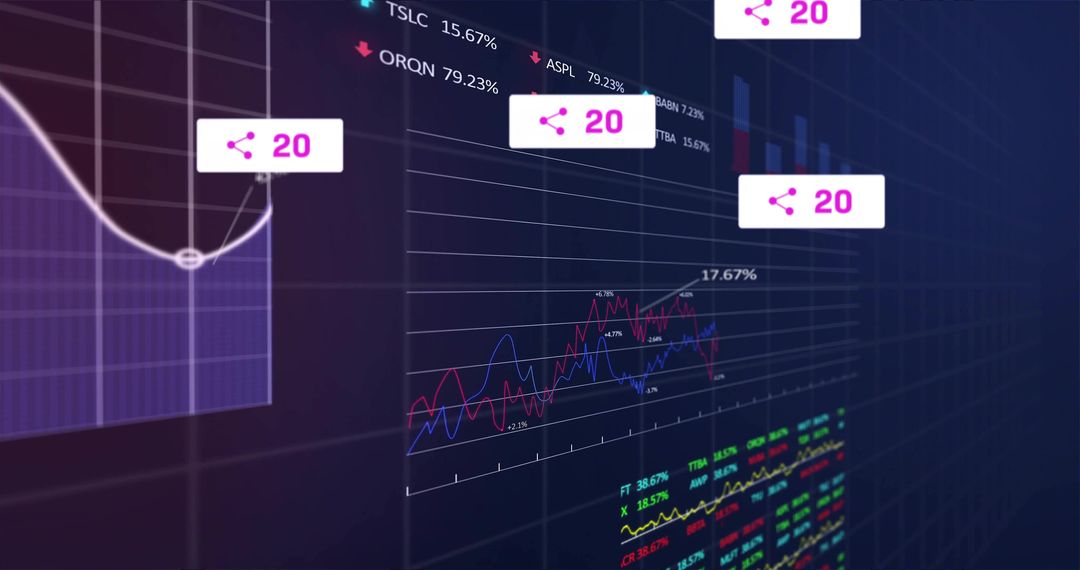
- Innovative Financial Dashboard with Acuity Analysis
Innovative Financial Dashboard with Acuity Analysis Image

Image represents a dynamic financial analysis interface with charts, nodes, and data labels. Ideal for presentations and publications focusing on modern financial technology, investment analytics, and corporate innovation strategies. Effective for illustrating concepts in finance education materials.
Powered by  - Get 15% off with code: PIKWIZARD15


0
downloads
downloads
Tags:
More
Credit Photo
If you would like to credit the Photo, here are some ways you can do so
Text Link
photo Link
<span class="text-link">
<span>
<a target="_blank" href=https://pikwizard.com/photo/innovative-financial-dashboard-with-acuity-analysis/a35d02b4b1034b16462cb6e939593987/>PikWizard</a>
</span>
</span>
<span class="image-link">
<span
style="margin: 0 0 20px 0; display: inline-block; vertical-align: middle; width: 100%;"
>
<a
target="_blank"
href="https://pikwizard.com/photo/innovative-financial-dashboard-with-acuity-analysis/a35d02b4b1034b16462cb6e939593987/"
style="text-decoration: none; font-size: 10px; margin: 0;"
>
<img src="https://pikwizard.com/pw/medium/a35d02b4b1034b16462cb6e939593987.jpg" style="margin: 0; width: 100%;" alt="" />
<p style="font-size: 12px; margin: 0;">PikWizard</p>
</a>
</span>
</span>
Free (free of charge)
Free for personal and commercial use.
Author: Awesome Content
Similar Free Stock Images

Premium


Premium


Premium


Premium


Premium


Premium


Premium


Premium


Premium


Premium


Premium


Premium


Premium


Premium


Premium


Premium


Premium


Premium


Premium


Premium


Premium


Premium


Premium


Premium

