
- Home >
- Stock Photos >
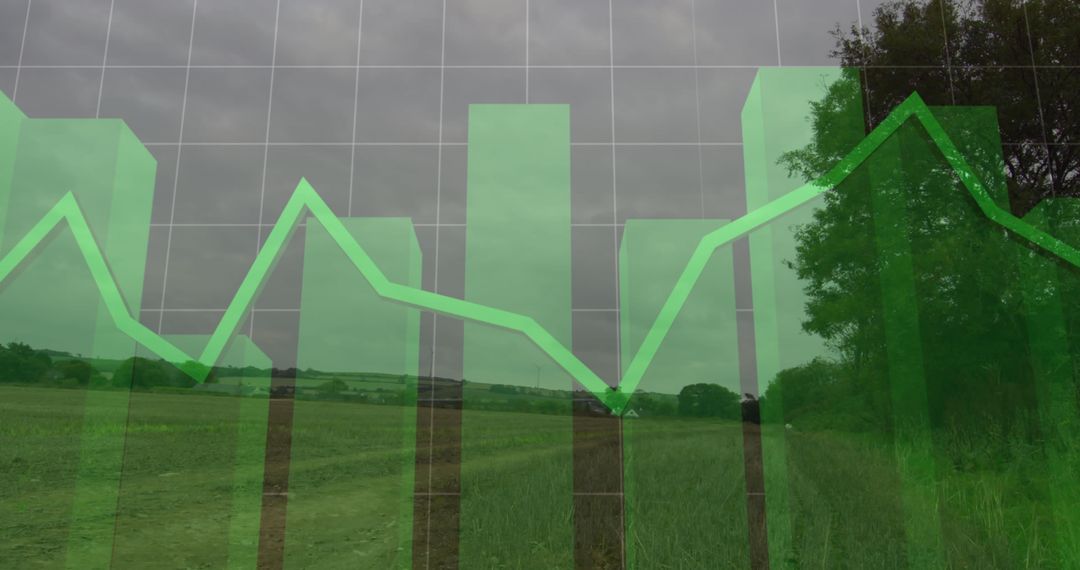
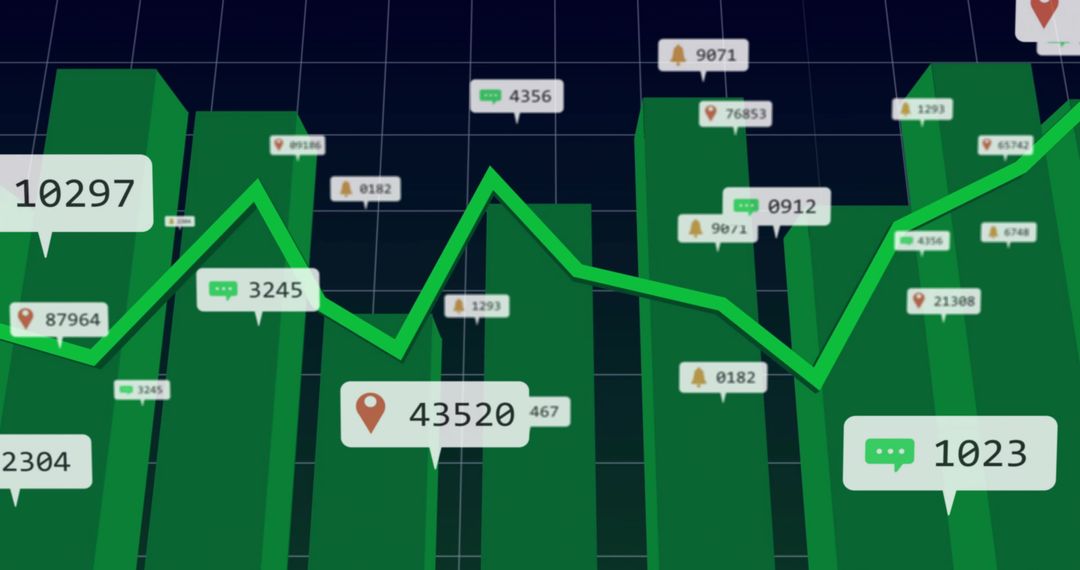
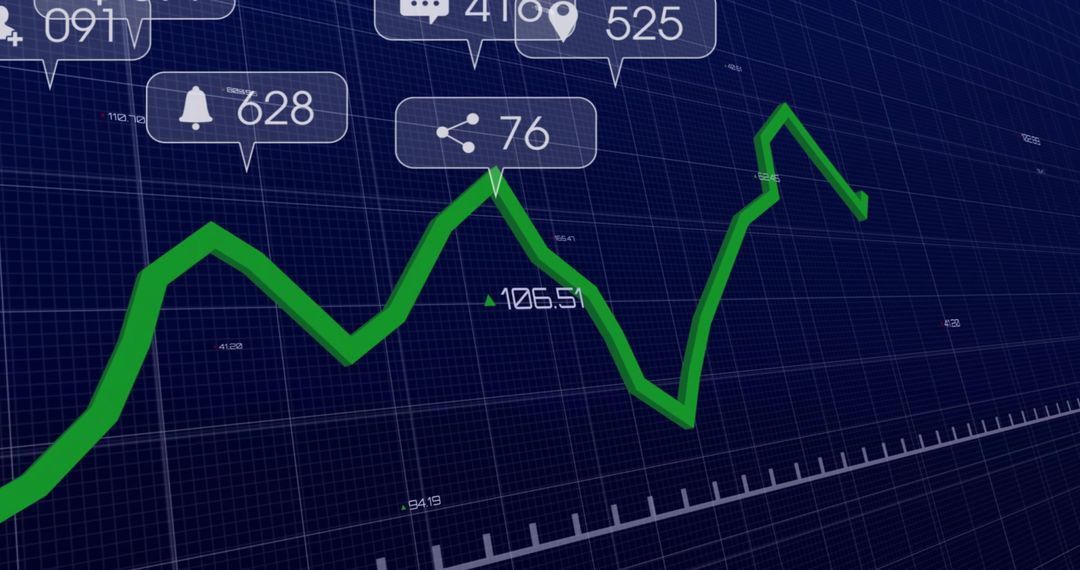
- Interactive dashboard callout displaying 95 messages over 3D green bar chart and polyline
Interactive dashboard callout displaying 95 messages over 3D green bar chart and polyline Image

Graphic showing blue speech-bubble callout with 95 chat-icon pointing to green 3D bars and matching polyline on navy grid. Perfect for illustrating engagement metrics, notification spikes, or chat volume in dashboards and reports. Use for presentation slides, investor decks, analytics dashboards, product landing pages, and social media posts. Works well for articles about user engagement, community growth, customer support workload, and data-driven marketing. Editable design allowing color, number, and layout customization to match brand guidelines.
Powered by 


0
downloads
downloads
Tags:
More
Credit Photo
If you would like to credit the Photo, here are some ways you can do so
Text Link
photo Link
<span class="text-link">
<span>
<a target="_blank" href=https://pikwizard.com/photo/interactive-dashboard-callout-displaying-95-messages-over-3d-green-bar-chart-and-polyline/f8cfec604d71c5fbbba60e0de17602d1/>PikWizard</a>
</span>
</span>
<span class="image-link">
<span
style="margin: 0 0 20px 0; display: inline-block; vertical-align: middle; width: 100%;"
>
<a
target="_blank"
href="https://pikwizard.com/photo/interactive-dashboard-callout-displaying-95-messages-over-3d-green-bar-chart-and-polyline/f8cfec604d71c5fbbba60e0de17602d1/"
style="text-decoration: none; font-size: 10px; margin: 0;"
>
<img src="https://pikwizard.com/pw/medium/f8cfec604d71c5fbbba60e0de17602d1.jpg" style="margin: 0; width: 100%;" alt="" />
<p style="font-size: 12px; margin: 0;">PikWizard</p>
</a>
</span>
</span>
Free (free of charge)
Free for personal and commercial use.
Author: People Creations
Similar Free Stock Images

Premium


Premium


Premium


Premium


Premium


Premium


Premium


Premium


Premium


Premium


Premium


Premium


Premium


Premium


Premium


Premium


Premium


Premium


Premium


Premium


Premium


Premium


Premium


Premium

