- Home >
- Stock Photos >
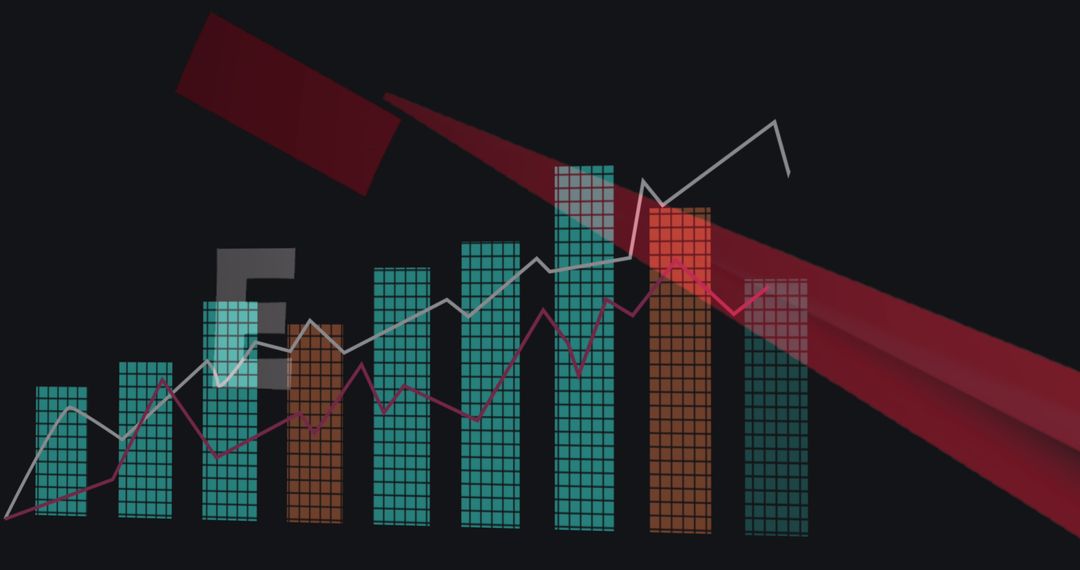
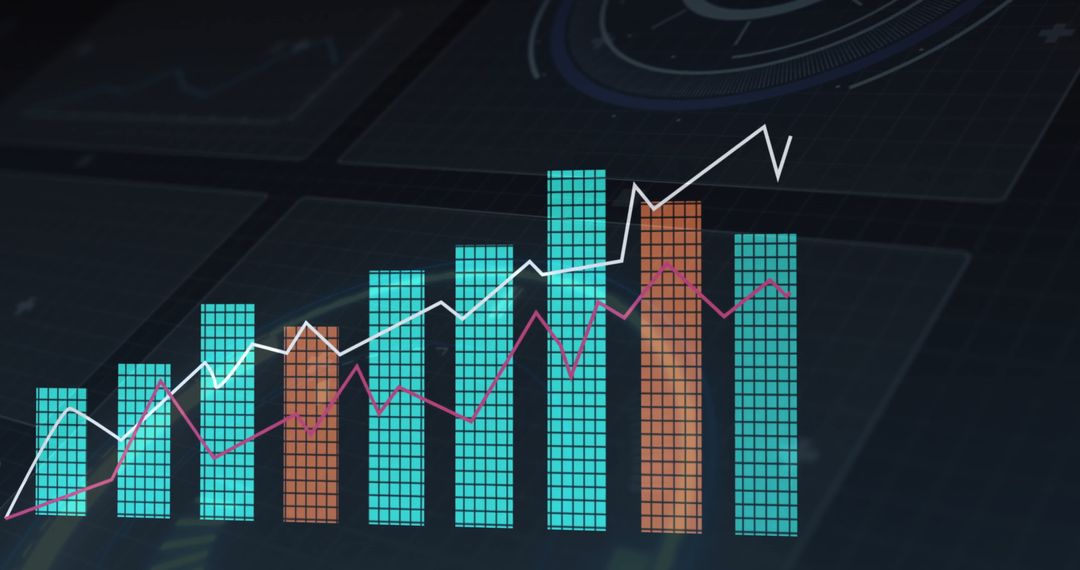
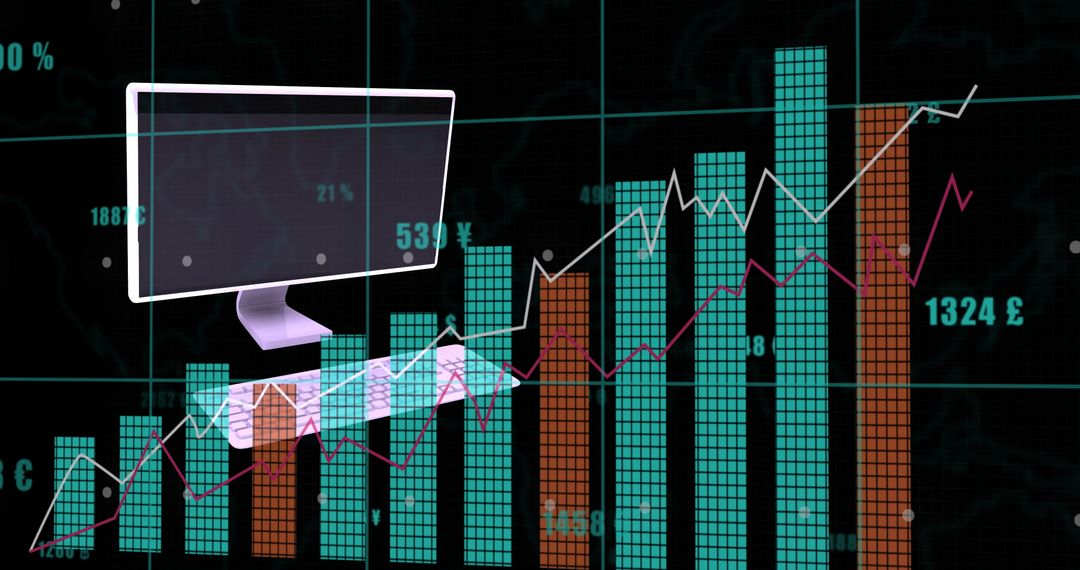
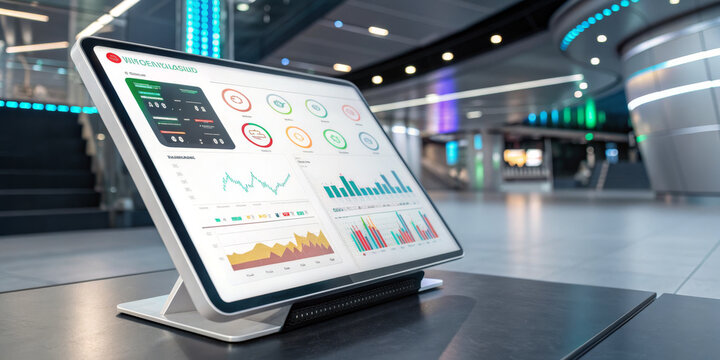
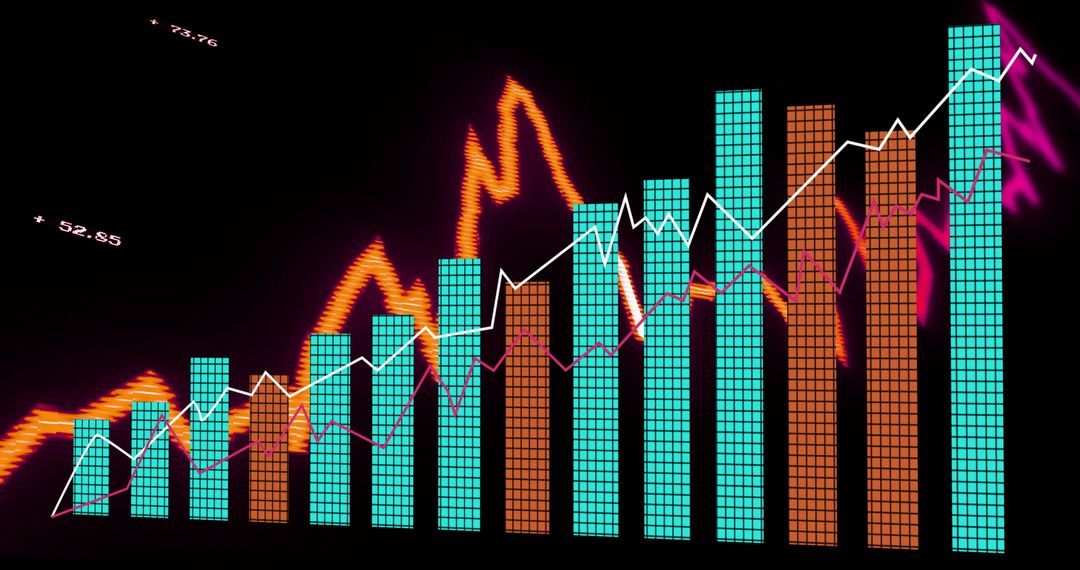
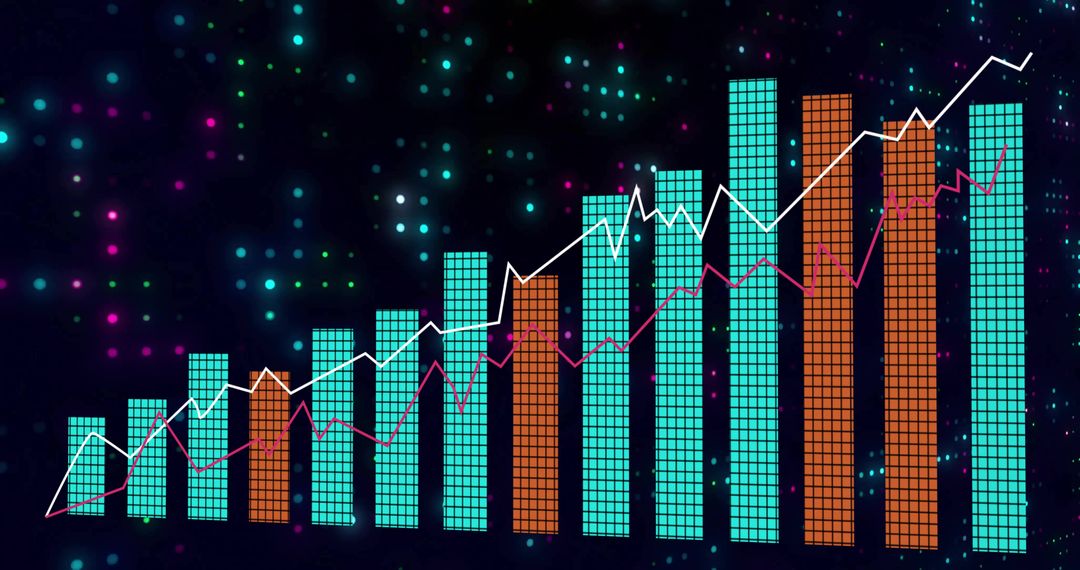
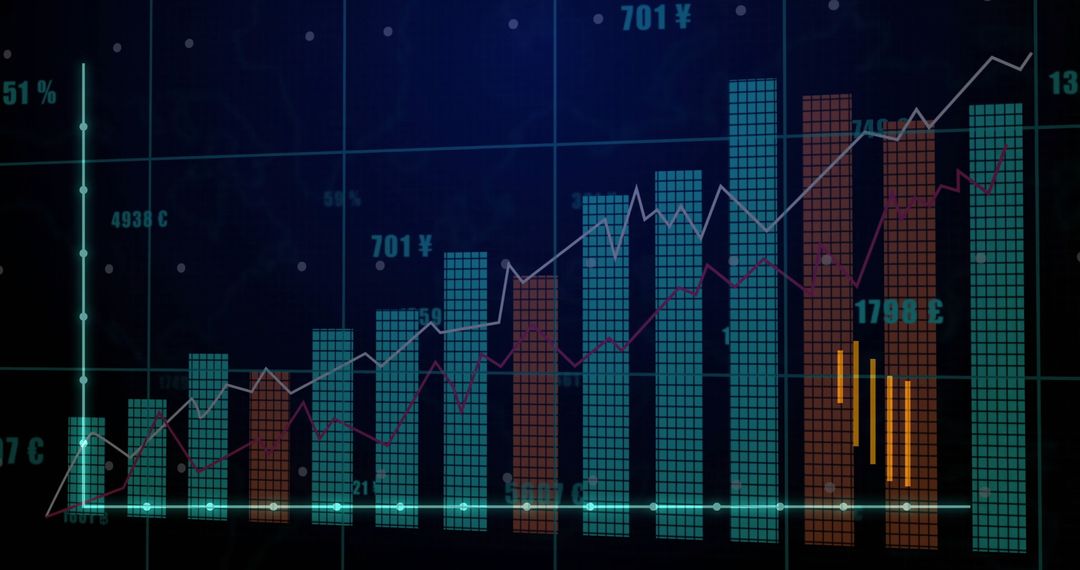
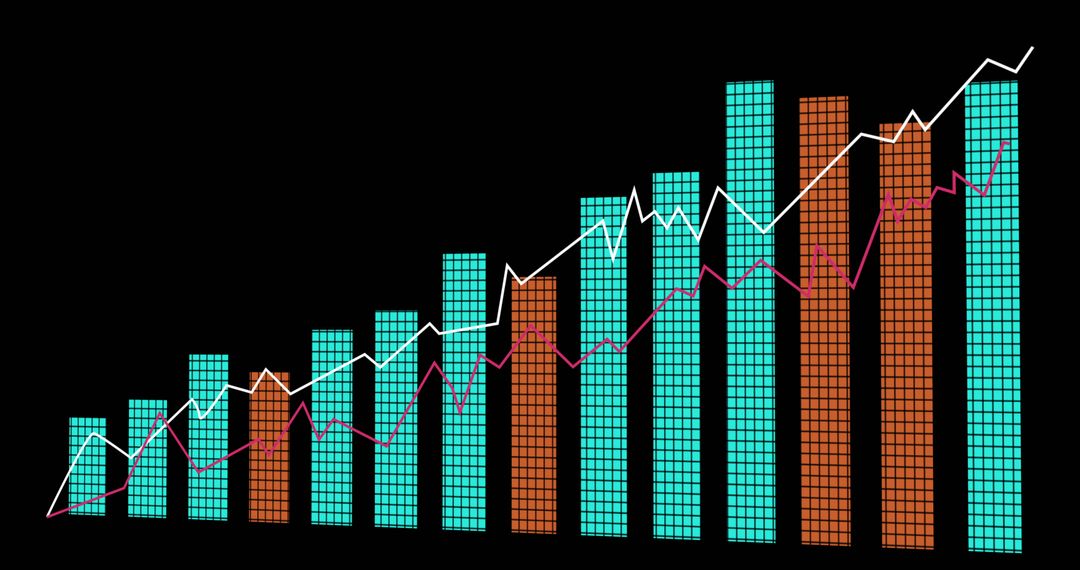
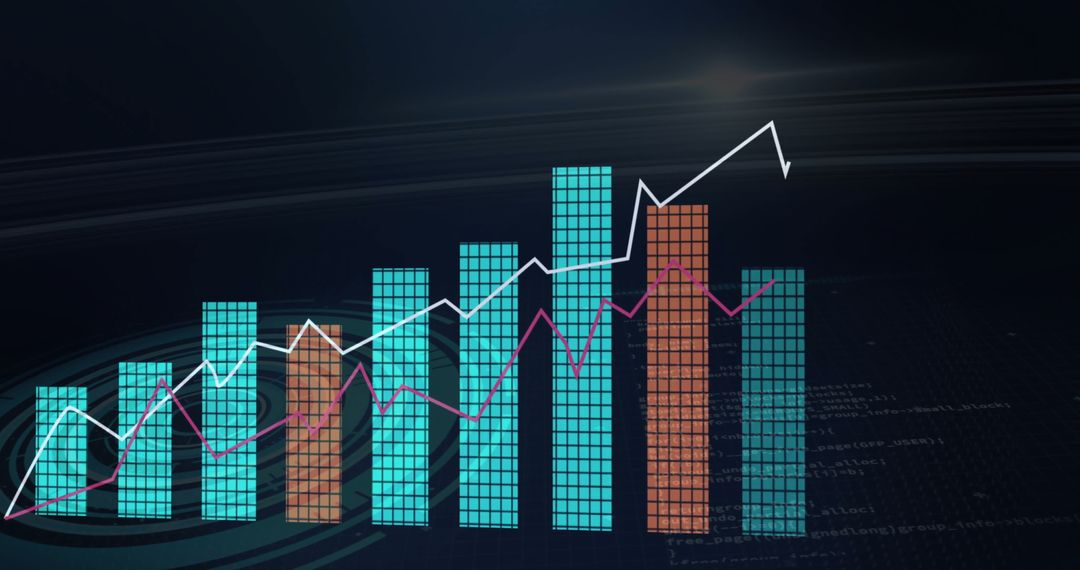
- Interactive Financial Dashboard with Bar and Line Graphs
Interactive Financial Dashboard with Bar and Line Graphs Image

An abstract digital display showing data with turquoise bars and a white trend line on a dark background. This visualization is ideal for presentations on market trends, financial performance, or dashboard interfaces. Can be used to depict dynamic analytics or financial forecasts for business reports and strategy meetings.
Powered by 


0
downloads
downloads
Tags:
More
Credit Photo
If you would like to credit the Photo, here are some ways you can do so
Text Link
photo Link
<span class="text-link">
<span>
<a target="_blank" href=https://pikwizard.com/photo/interactive-financial-dashboard-with-bar-and-line-graphs/1e24fed0e07bd33b2302e7976f1ccac6/>PikWizard</a>
</span>
</span>
<span class="image-link">
<span
style="margin: 0 0 20px 0; display: inline-block; vertical-align: middle; width: 100%;"
>
<a
target="_blank"
href="https://pikwizard.com/photo/interactive-financial-dashboard-with-bar-and-line-graphs/1e24fed0e07bd33b2302e7976f1ccac6/"
style="text-decoration: none; font-size: 10px; margin: 0;"
>
<img src="https://pikwizard.com/pw/medium/1e24fed0e07bd33b2302e7976f1ccac6.jpg" style="margin: 0; width: 100%;" alt="" />
<p style="font-size: 12px; margin: 0;">PikWizard</p>
</a>
</span>
</span>
Free (free of charge)
Free for personal and commercial use.
Author: Creative Art
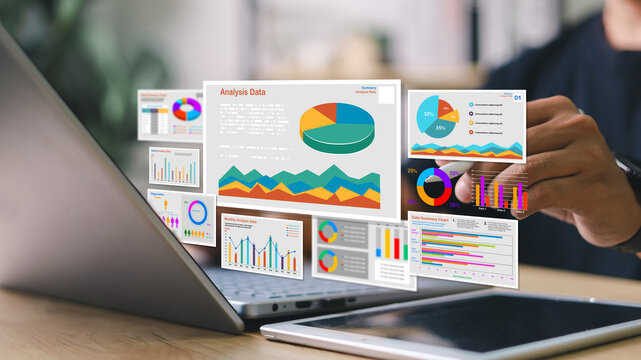
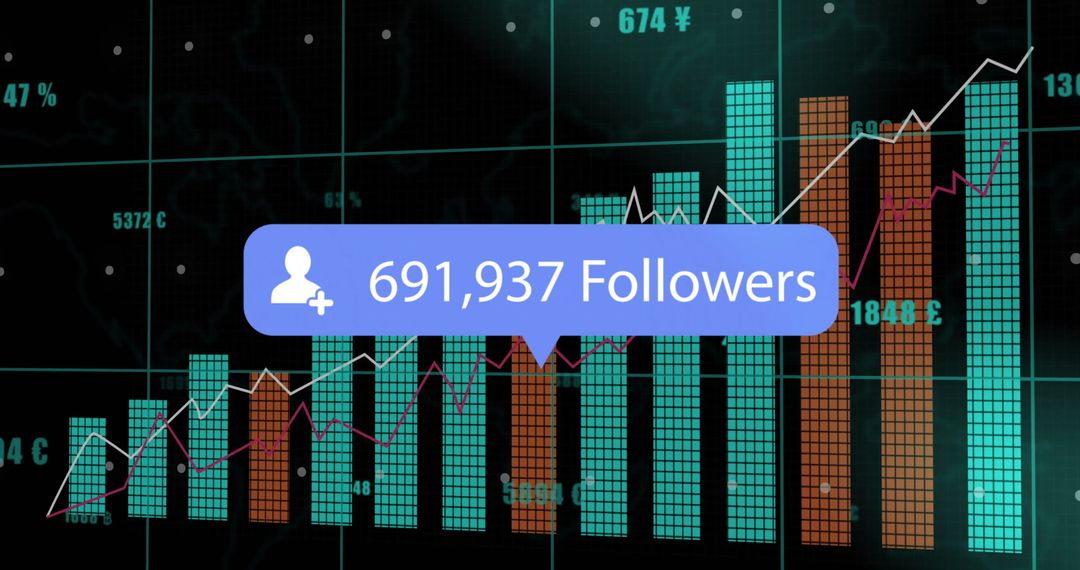
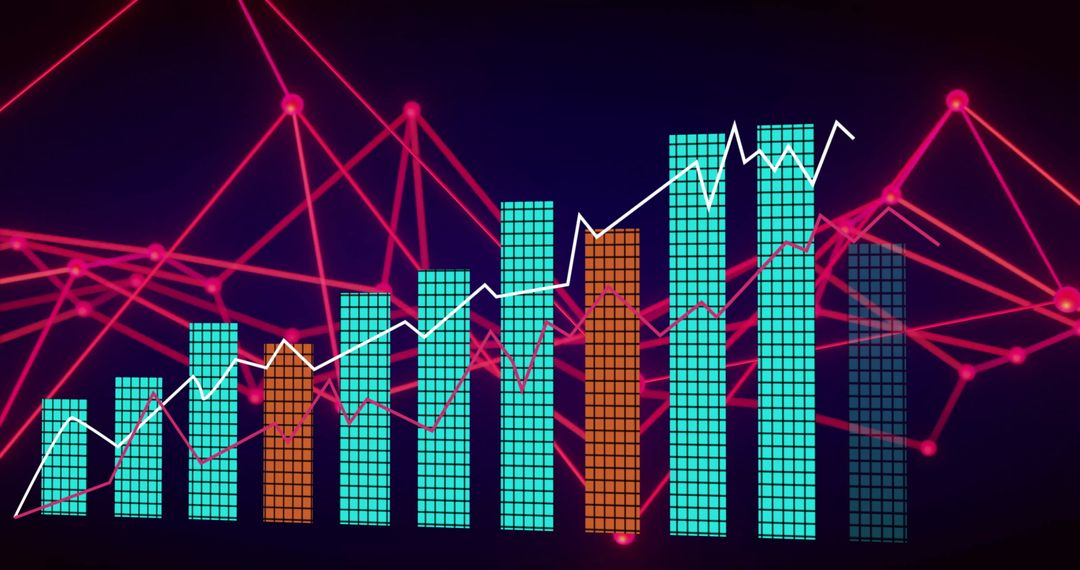
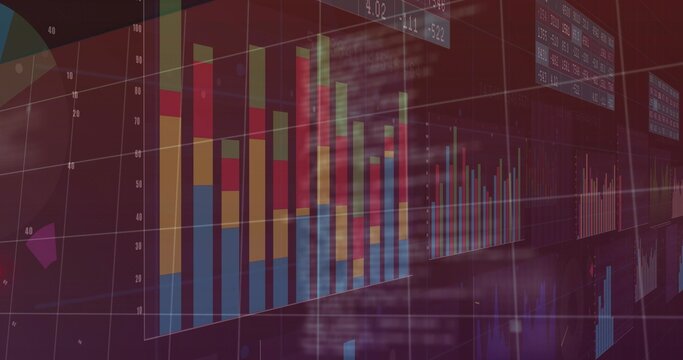
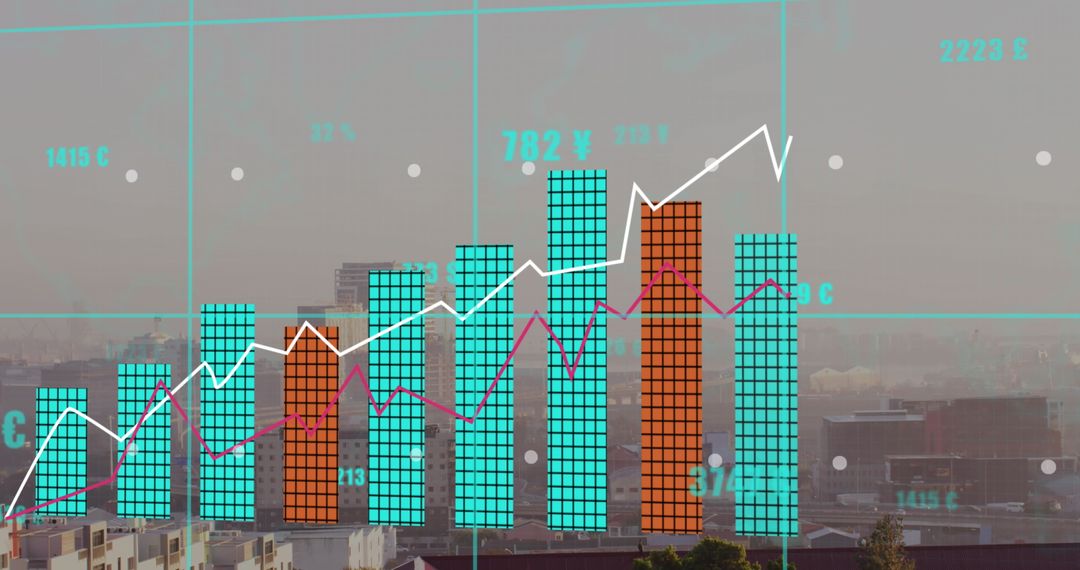
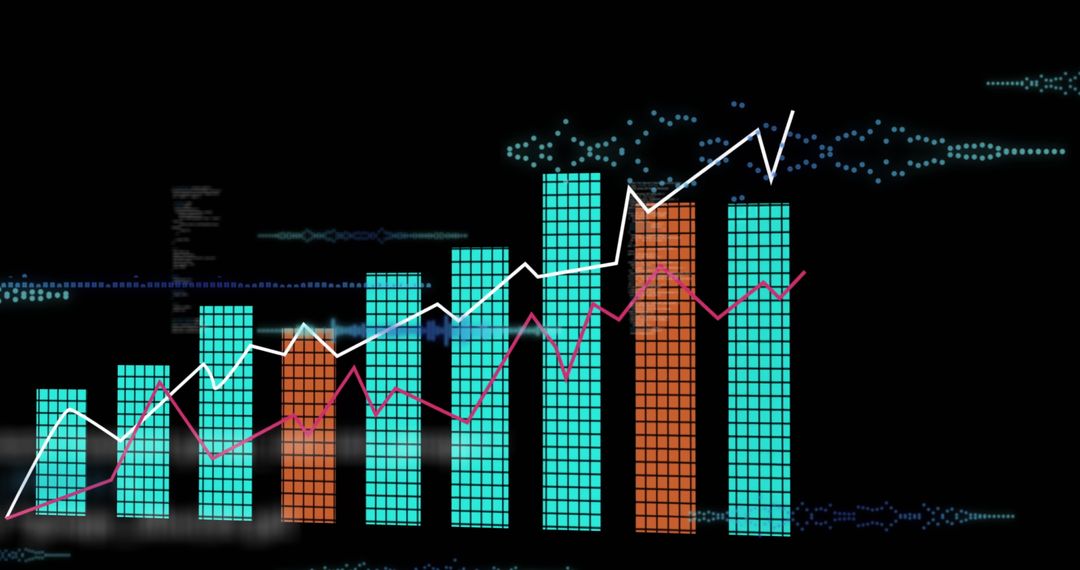
Similar Free Stock Images
Premium


Premium


Premium


Premium


Premium


Premium


Premium


Premium


Premium


Premium


Premium


Premium


Premium


Premium


Premium


Premium


Premium


Premium


Premium


Premium


Premium


Premium


Premium


Premium