- Home >
- Stock Photos >
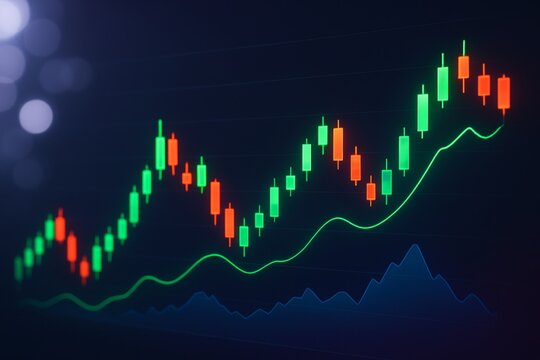
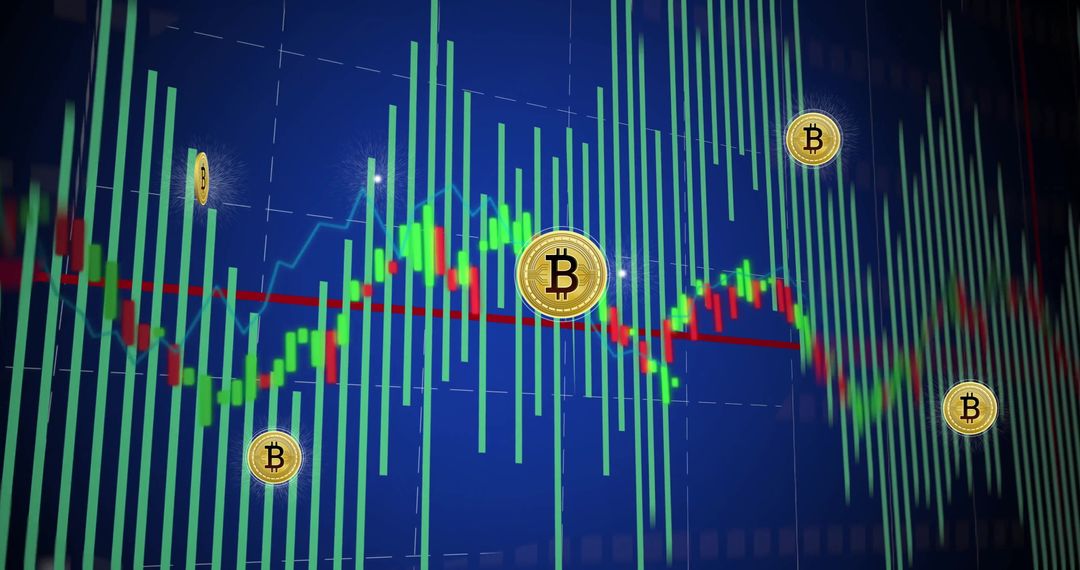
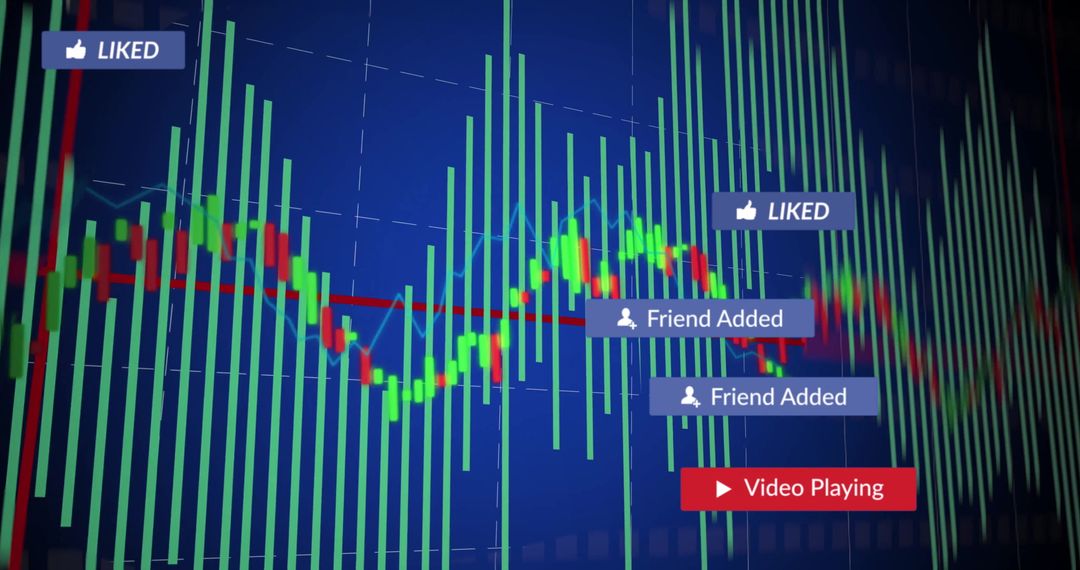
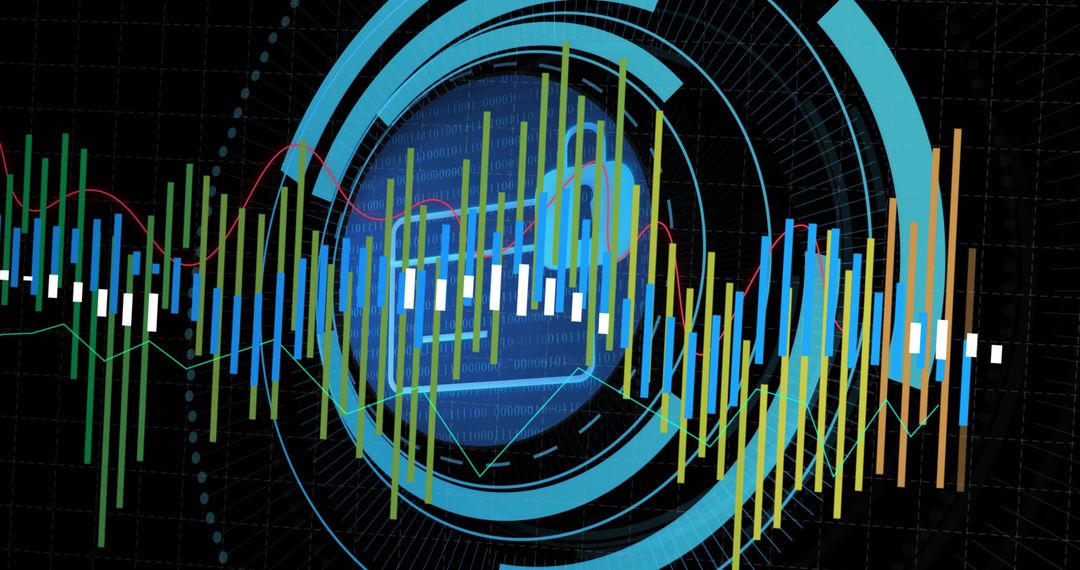
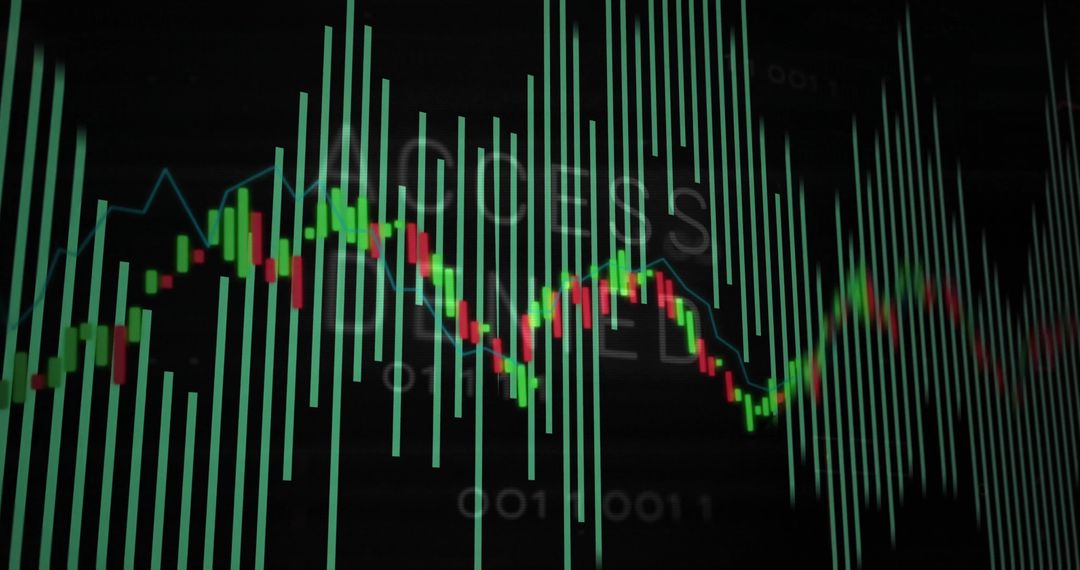
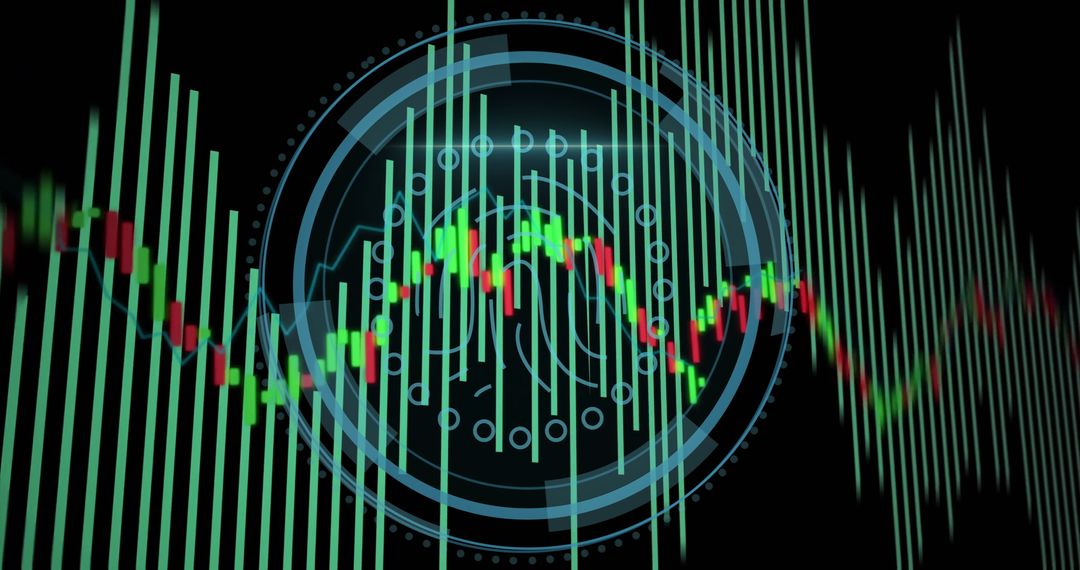
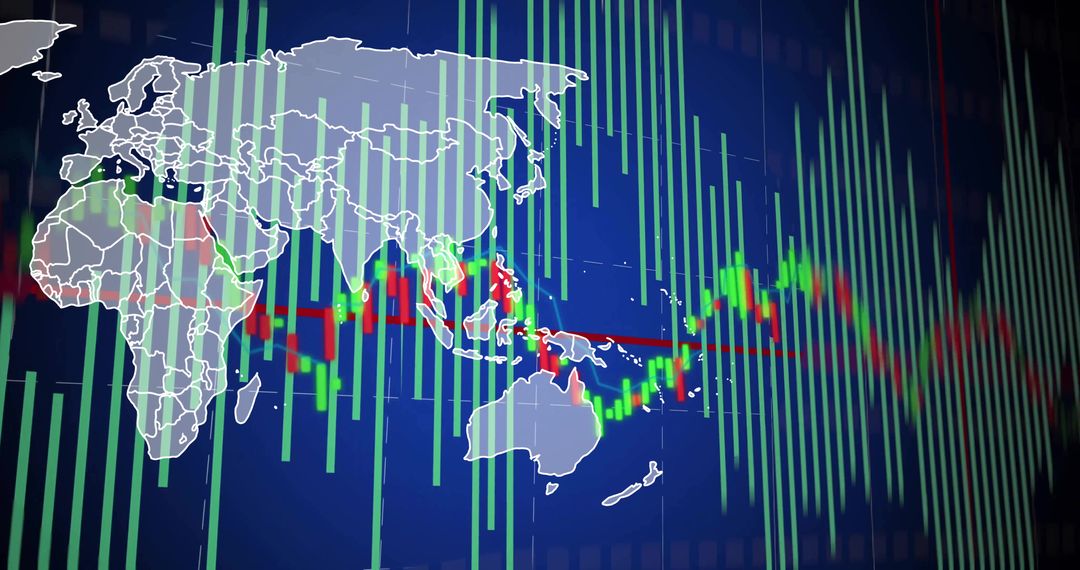
- Market dashboard visualizing neon candlesticks, histogram bars and HUD rings for trading
Market dashboard visualizing neon candlesticks, histogram bars and HUD rings for trading Image

Displaying neon-green histogram bars, red and green candlesticks, red price line and concentric HUD rings over deep blue digital grid. Conveying high-tech market monitoring, rapid price movement and analytics-ready data. Using for website hero banners, trading platform UI mockups, financial blog headers, presentation slides, social media posts, video thumbnails and ad creatives. Positioning clear space at top or left for headline and call-to-action. Cropping for wide formats keeps candlesticks and HUD center while preserving readable histogram bars. Pairing with bold sans-serif typography and neon accent colors for modern fintech branding. Suitable for topics such as market volatility, trading strategy, stock analysis, algorithmic trading, crypto charts and investor reports.
Powered by 


0
downloads
downloads
Tags:
More
Credit Photo
If you would like to credit the Photo, here are some ways you can do so
Text Link
photo Link
<span class="text-link">
<span>
<a target="_blank" href=https://pikwizard.com/photo/market-dashboard-visualizing-neon-candlesticks-histogram-bars-and-hud-rings-for-trading/37afd695a4be6fc768e47040ea07683a/>PikWizard</a>
</span>
</span>
<span class="image-link">
<span
style="margin: 0 0 20px 0; display: inline-block; vertical-align: middle; width: 100%;"
>
<a
target="_blank"
href="https://pikwizard.com/photo/market-dashboard-visualizing-neon-candlesticks-histogram-bars-and-hud-rings-for-trading/37afd695a4be6fc768e47040ea07683a/"
style="text-decoration: none; font-size: 10px; margin: 0;"
>
<img src="https://pikwizard.com/pw/medium/37afd695a4be6fc768e47040ea07683a.jpg" style="margin: 0; width: 100%;" alt="" />
<p style="font-size: 12px; margin: 0;">PikWizard</p>
</a>
</span>
</span>
Free (free of charge)
Free for personal and commercial use.
Author: Creative Art
Similar Free Stock Images

Premium


Premium


Premium


Premium


Premium


Premium


Premium


Premium


Premium


Premium


Premium


Premium


Premium


Premium


Premium


Premium


Premium


Premium


Premium


Premium


Premium


Premium


Premium


Premium