- Home >
- Stock Photos >
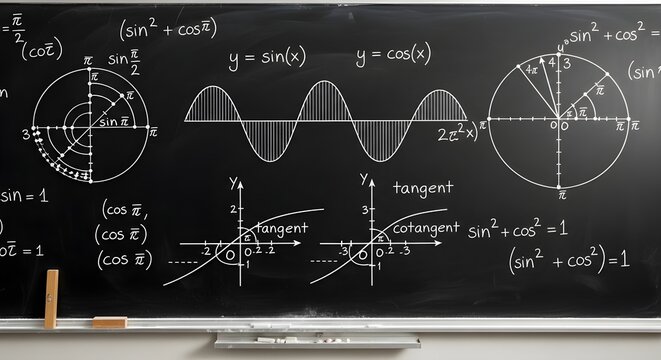
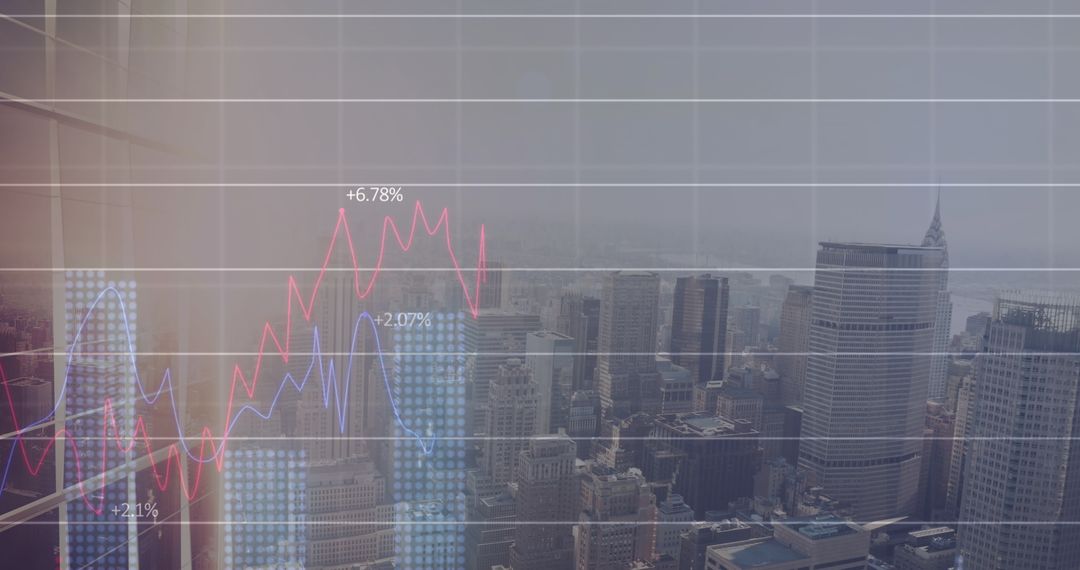
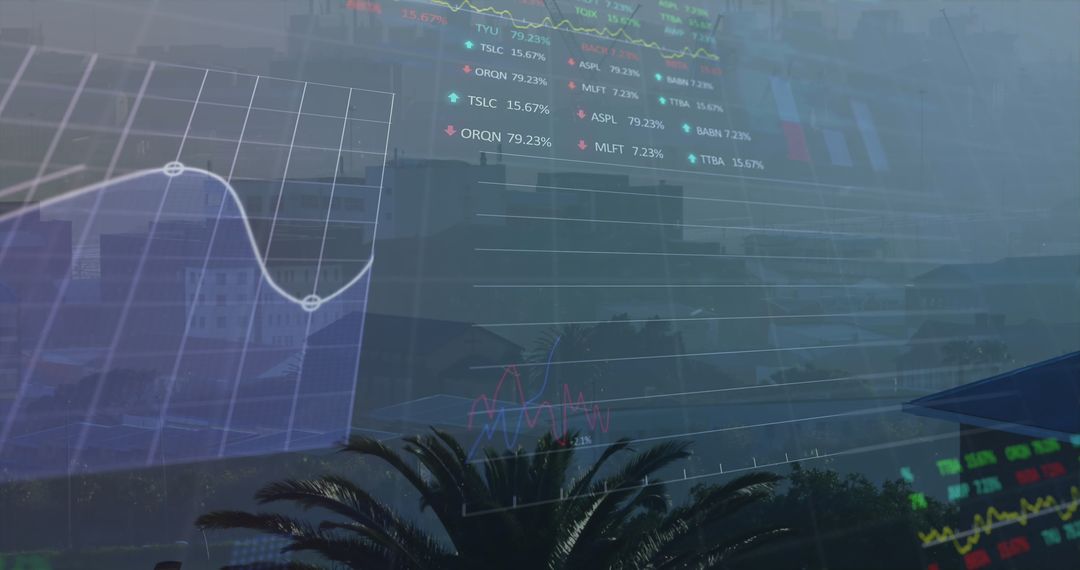
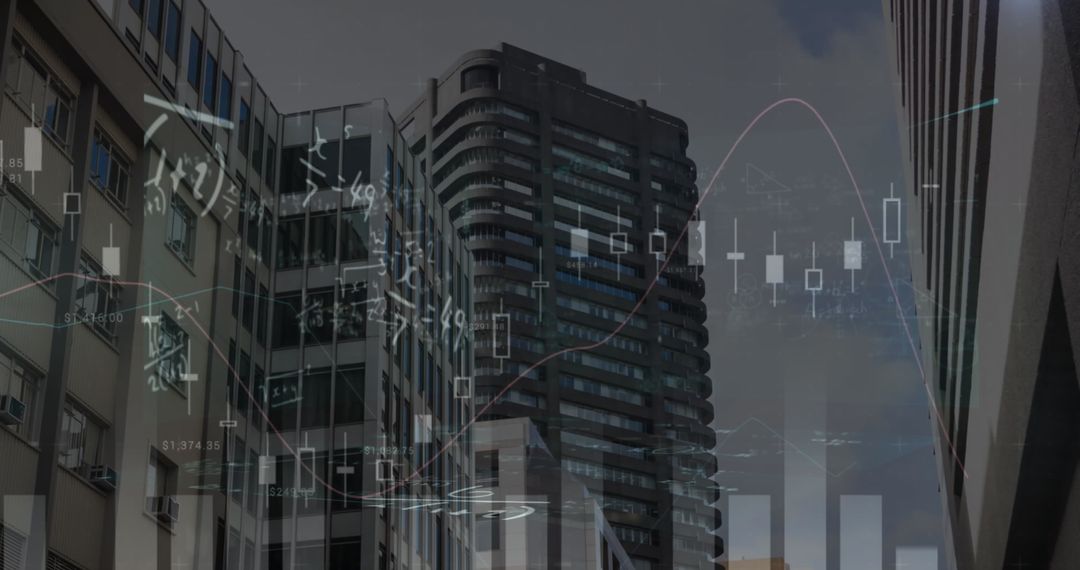
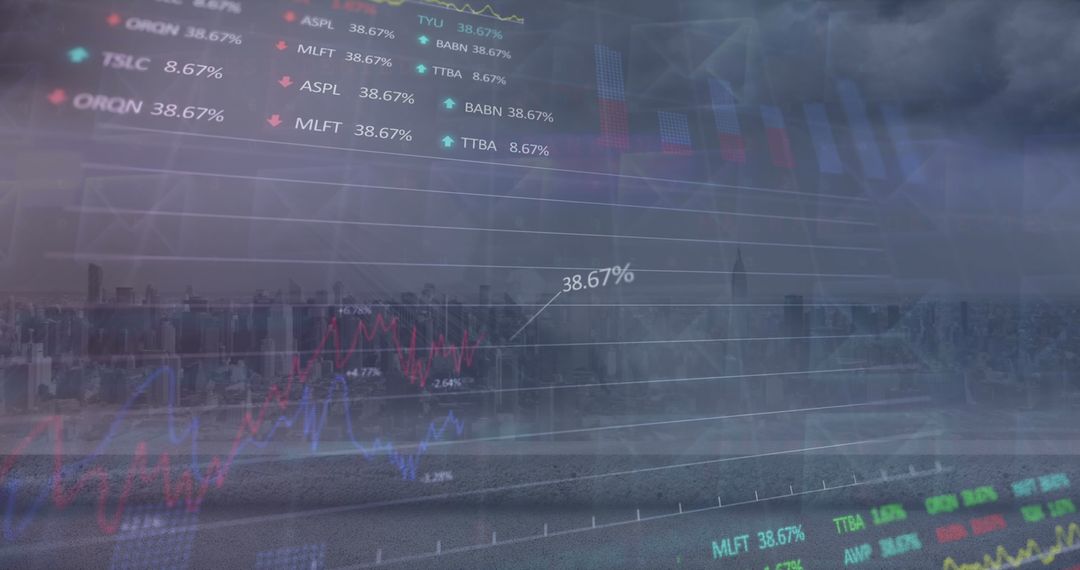
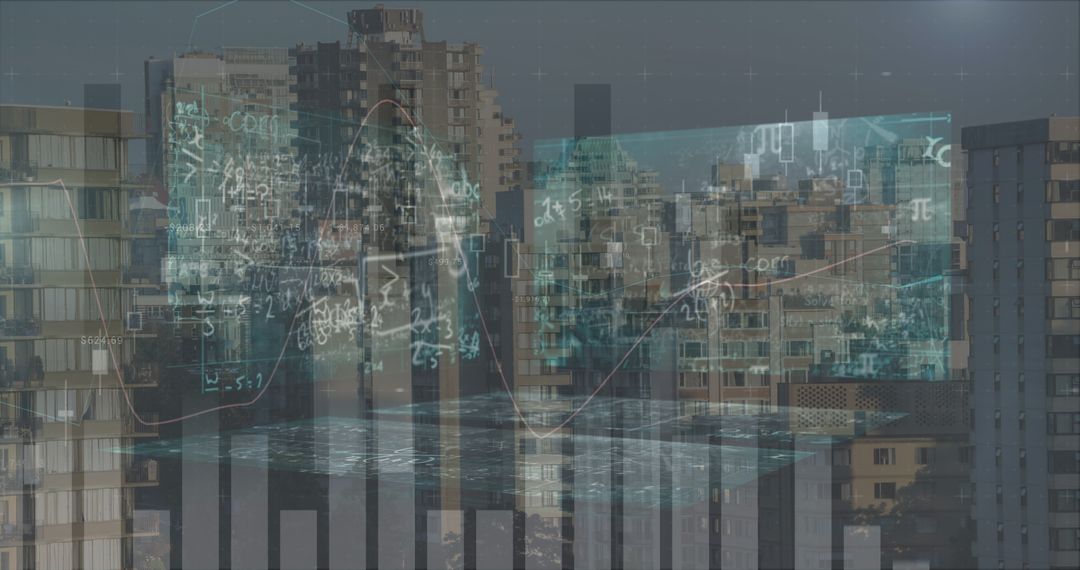
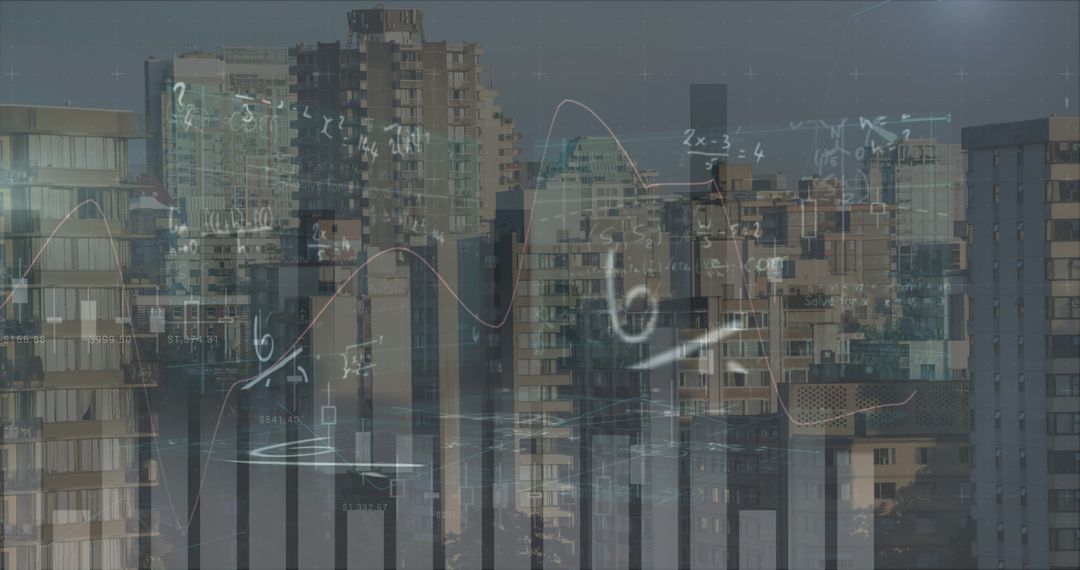
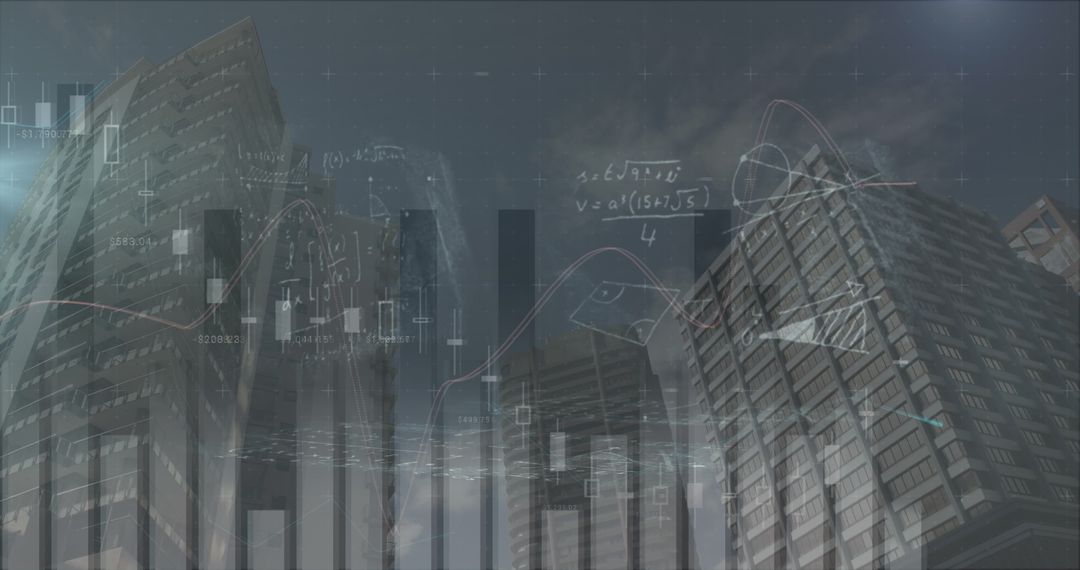
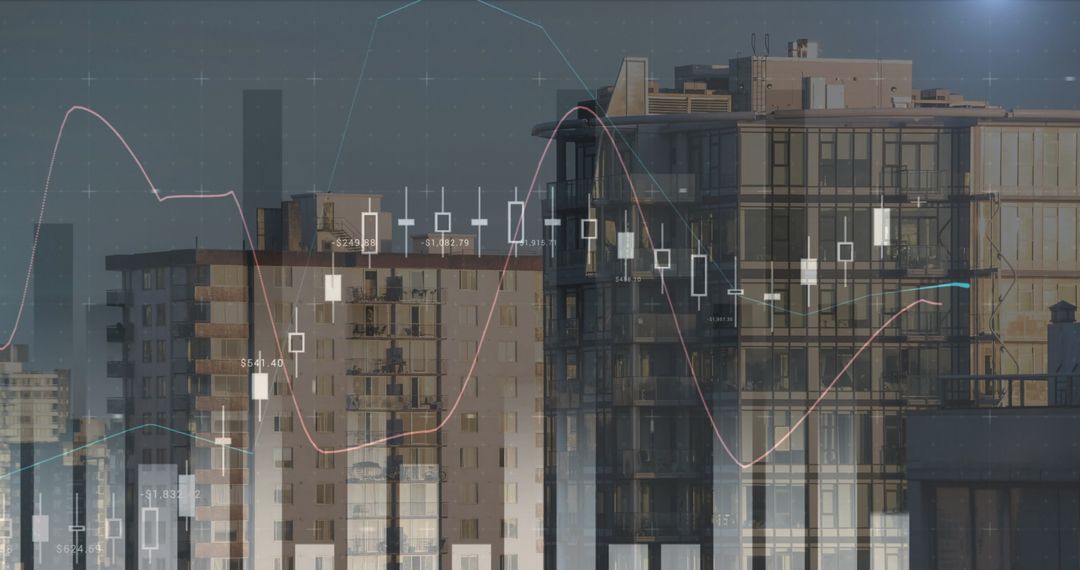
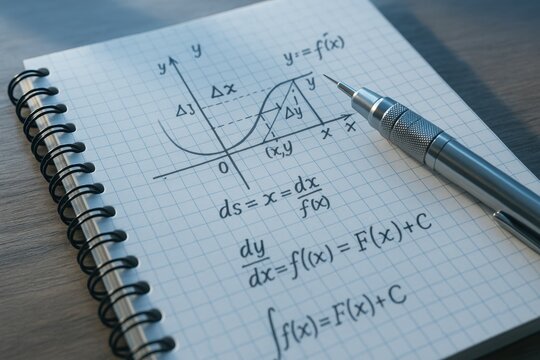
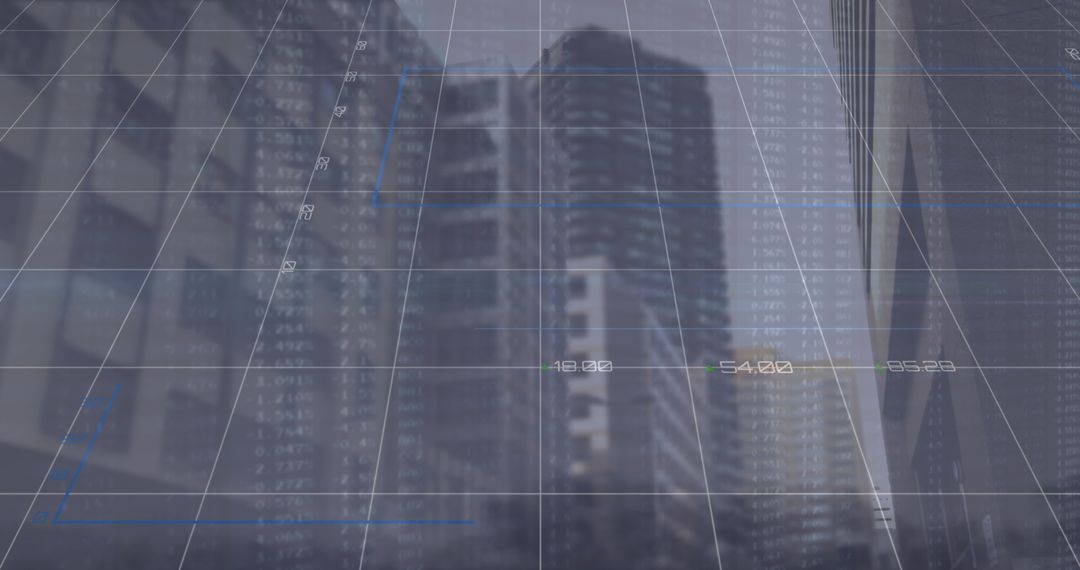
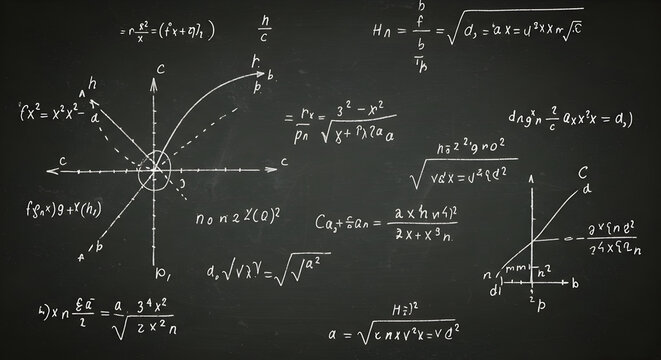
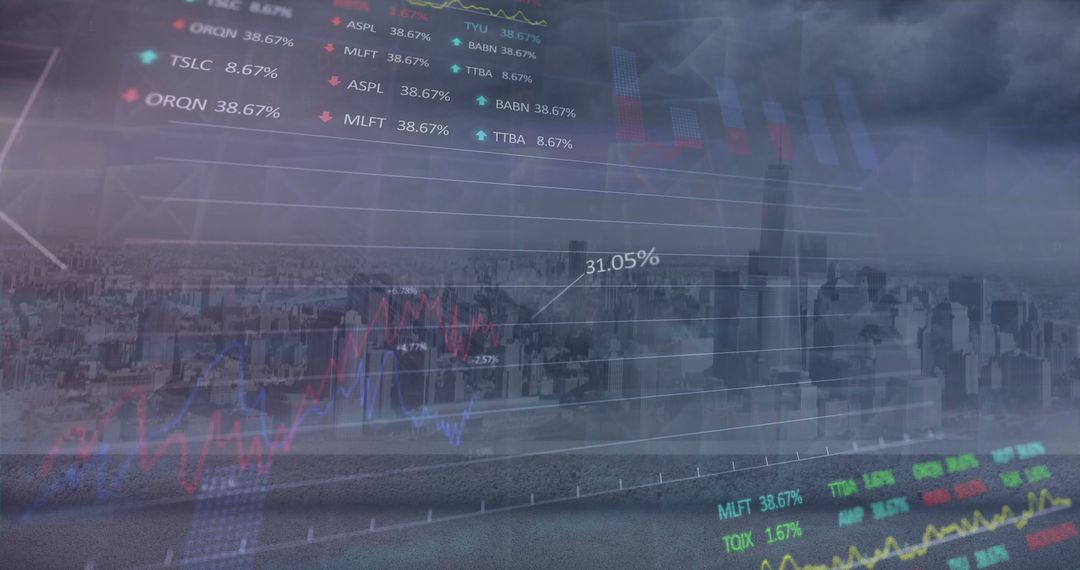
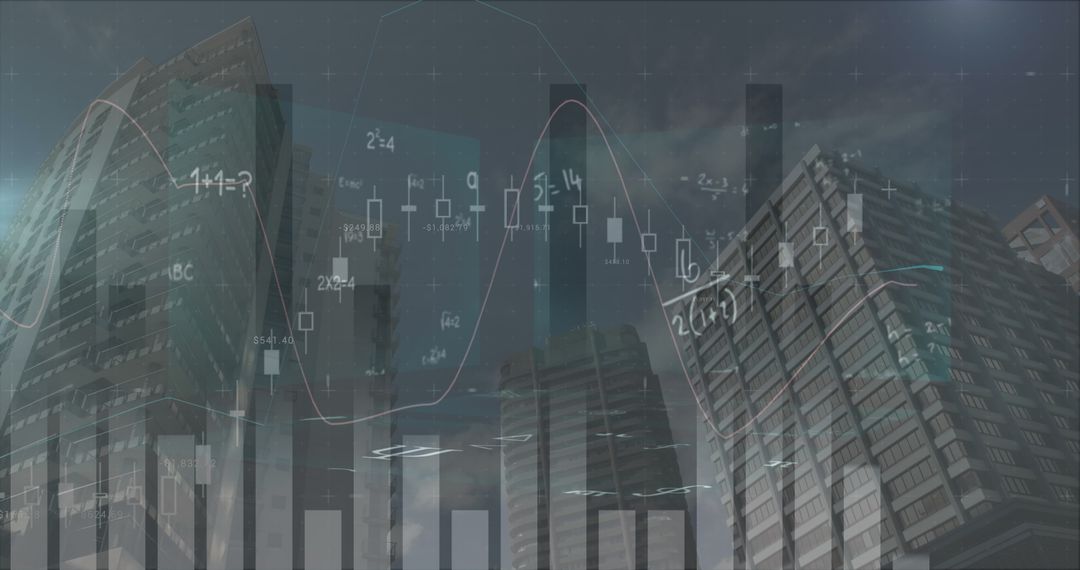
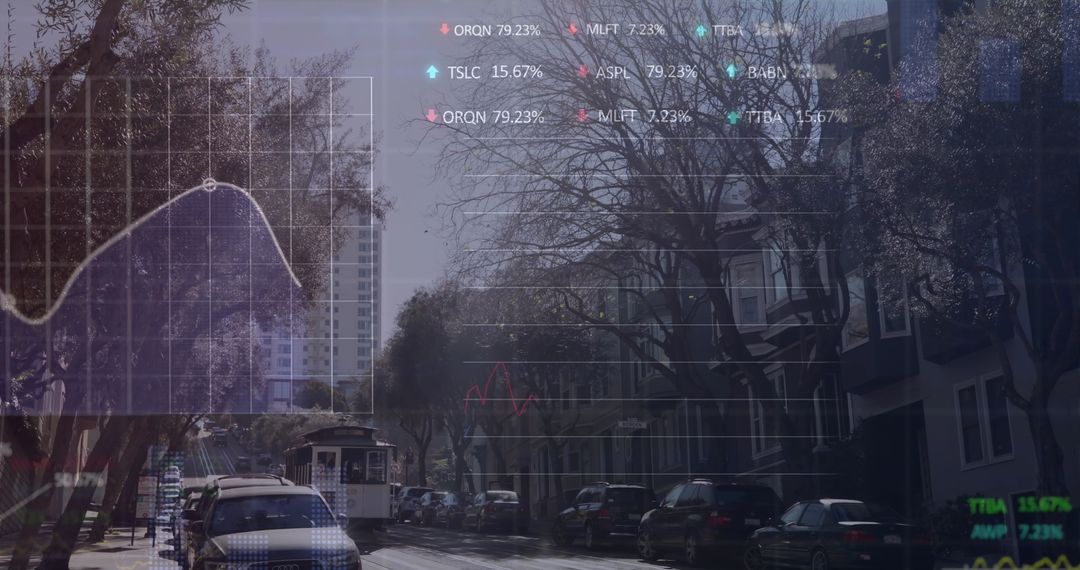
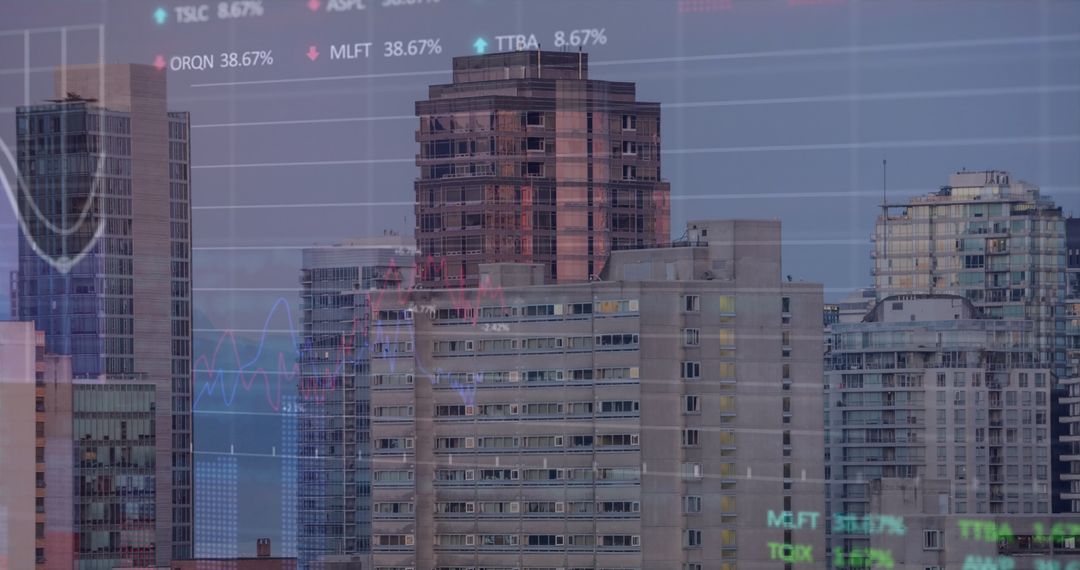
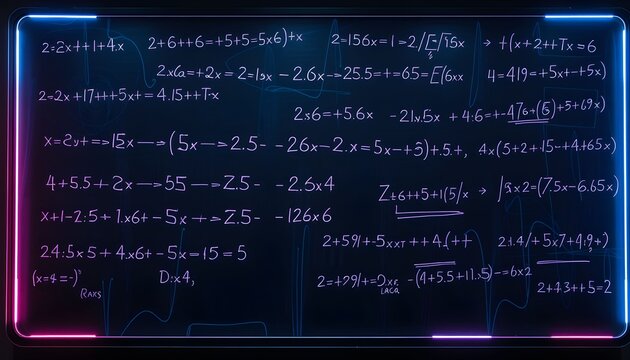
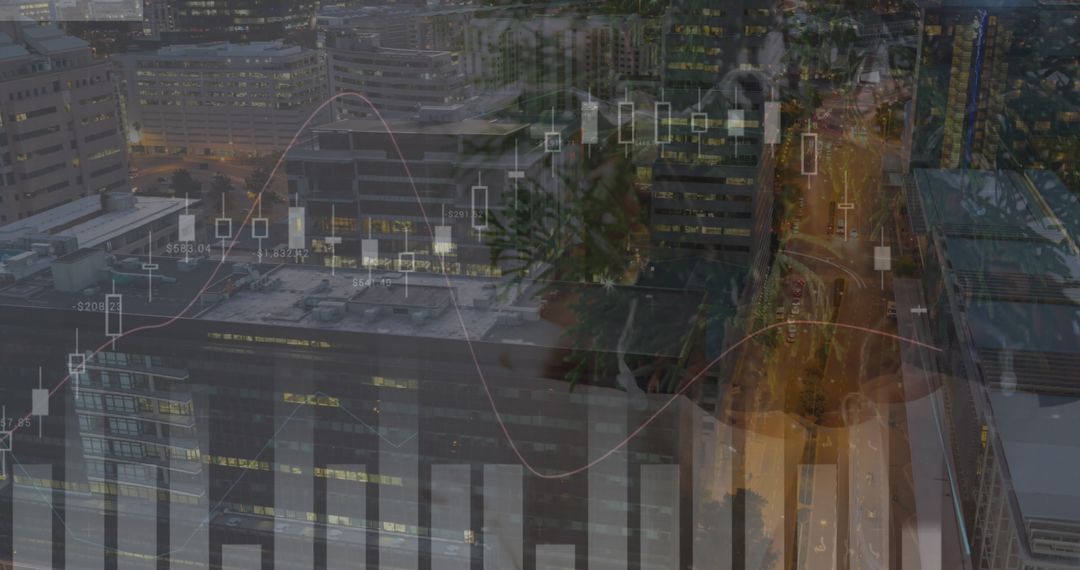
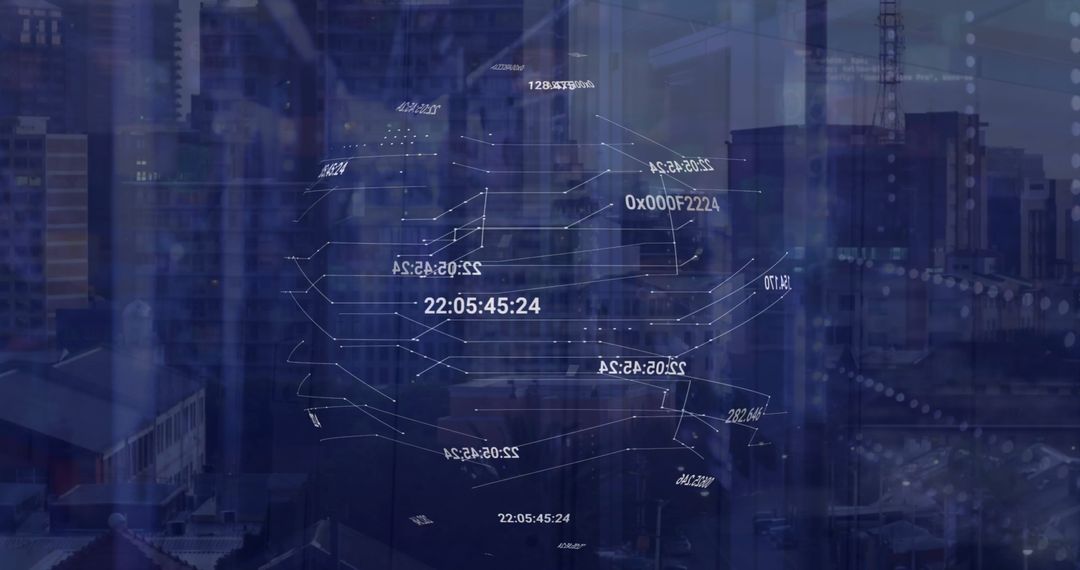
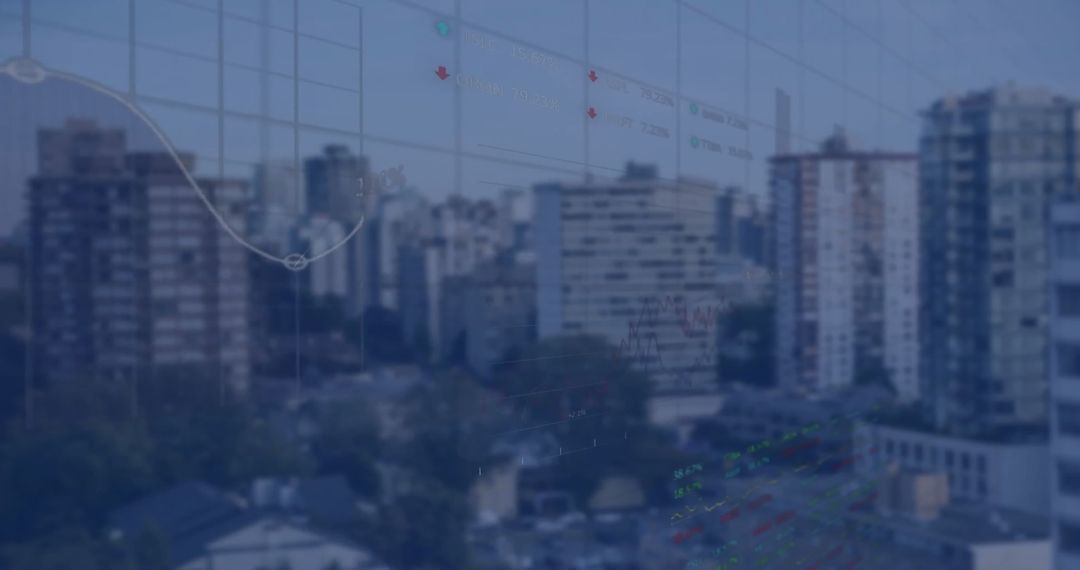
- Mathematical Equations and Graphs Overlay on City Skyscrapers
Mathematical Equations and Graphs Overlay on City Skyscrapers Image

Concept illustrates blend of mathematics and urban environment, symbolizing modern innovation, technological integration in city planning, and financial analysis. Useful for editorial pieces on smart cities, tech integration, economic studies, and educational content focused on STEM initiatives.
Powered by 

4
downloads
downloads
Tags:
More
Credit Photo
If you would like to credit the Photo, here are some ways you can do so
Text Link
photo Link
<span class="text-link">
<span>
<a target="_blank" href=https://pikwizard.com/photo/mathematical-equations-and-graphs-overlay-on-city-skyscrapers/605509ba90b69d951cc52a2eeb71d353/>PikWizard</a>
</span>
</span>
<span class="image-link">
<span
style="margin: 0 0 20px 0; display: inline-block; vertical-align: middle; width: 100%;"
>
<a
target="_blank"
href="https://pikwizard.com/photo/mathematical-equations-and-graphs-overlay-on-city-skyscrapers/605509ba90b69d951cc52a2eeb71d353/"
style="text-decoration: none; font-size: 10px; margin: 0;"
>
<img src="https://pikwizard.com/pw/medium/605509ba90b69d951cc52a2eeb71d353.jpg" style="margin: 0; width: 100%;" alt="" />
<p style="font-size: 12px; margin: 0;">PikWizard</p>
</a>
</span>
</span>
Free (free of charge)
Free for personal and commercial use.
Author: People Creations
Similar Free Stock Images

Premium


Premium


Premium


Premium


Premium


Premium


Premium


Premium


Premium


Premium


Premium


Premium


Premium


Premium


Premium


Premium


Premium


Premium


Premium


Premium


Premium


Premium


Premium


Premium