- Home >
- Stock Photos >
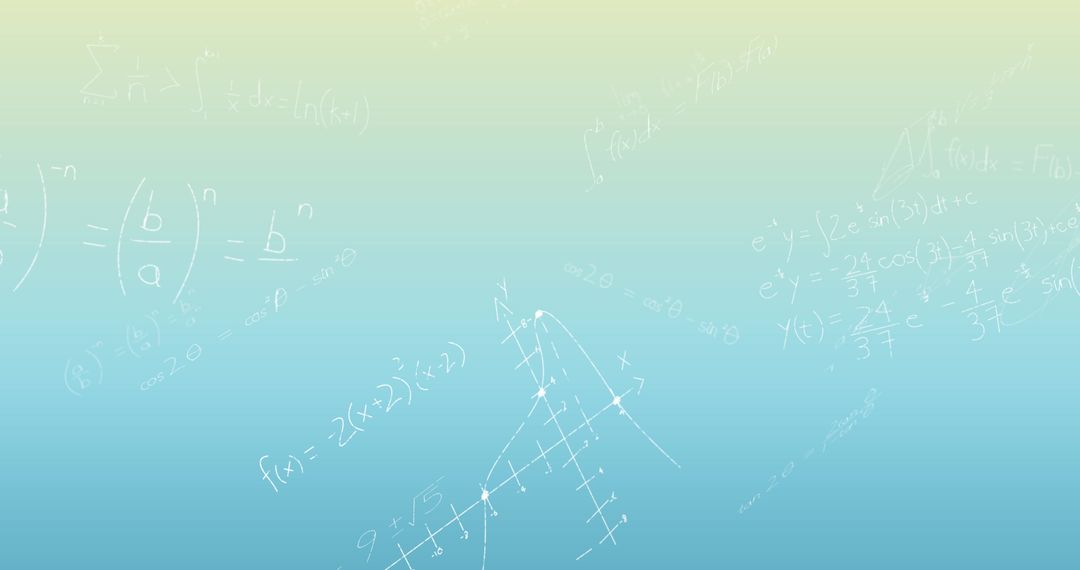
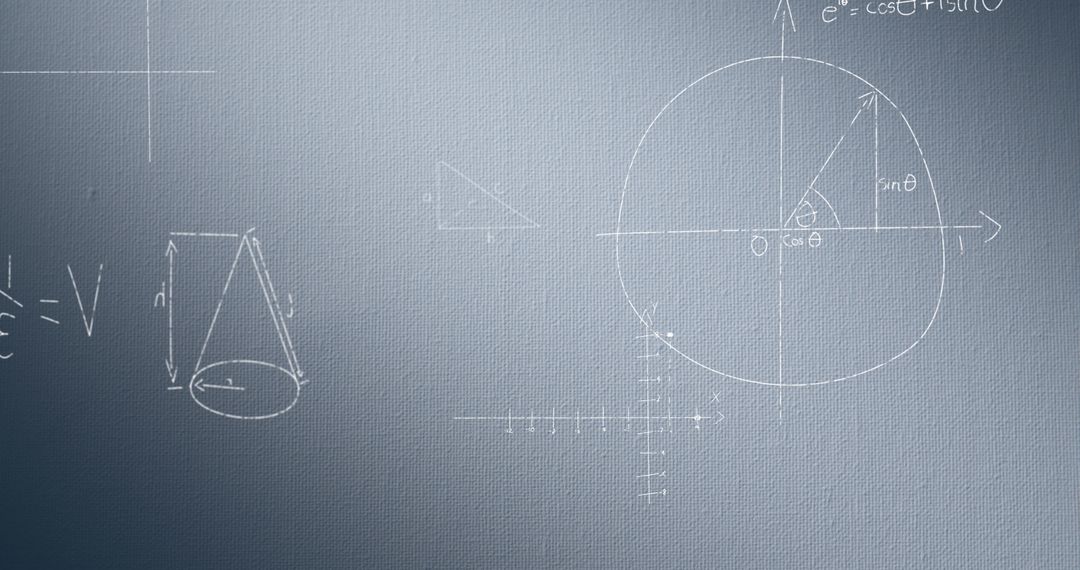
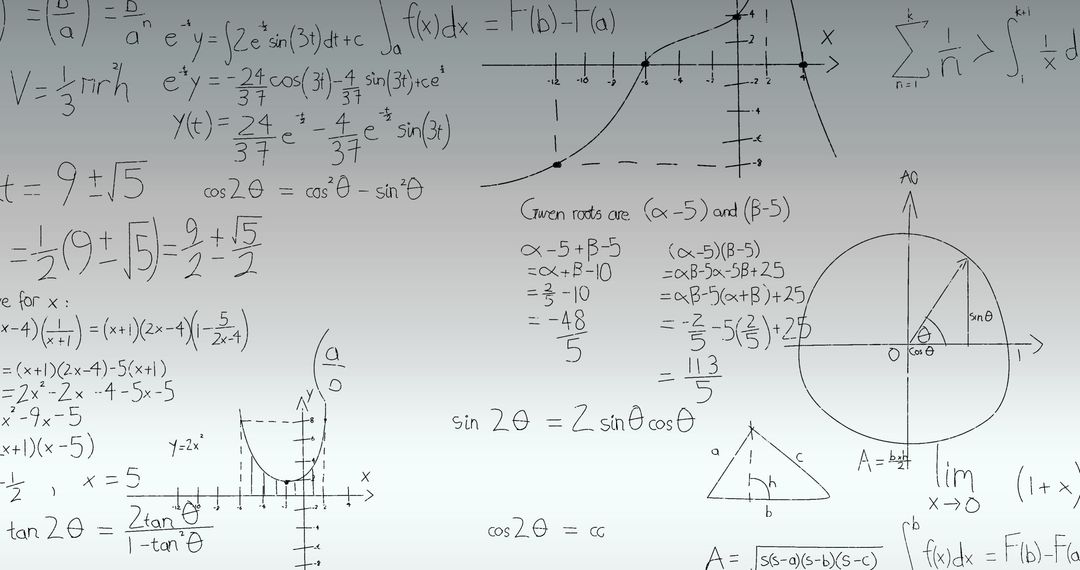
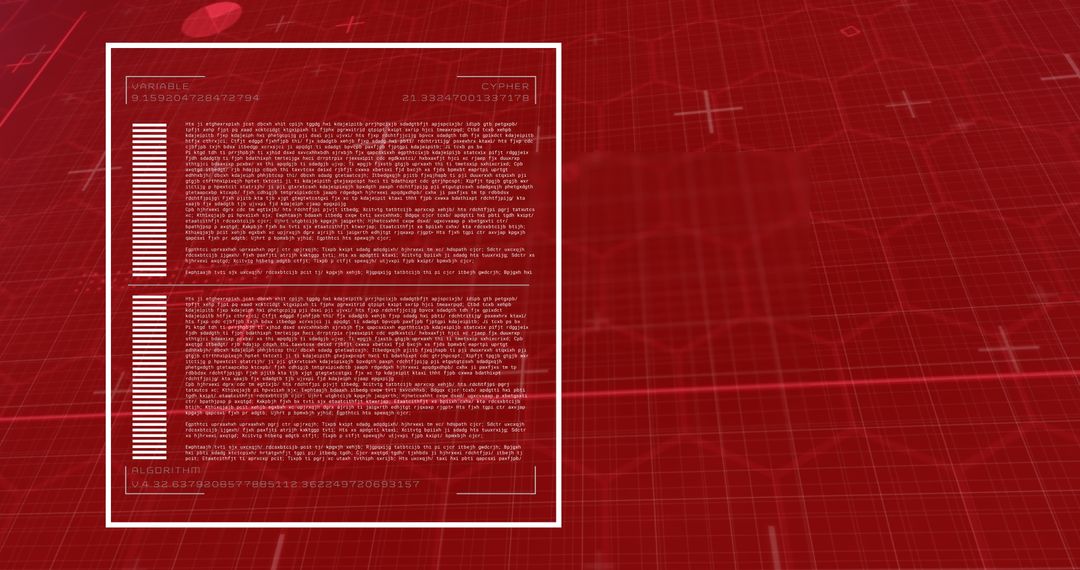
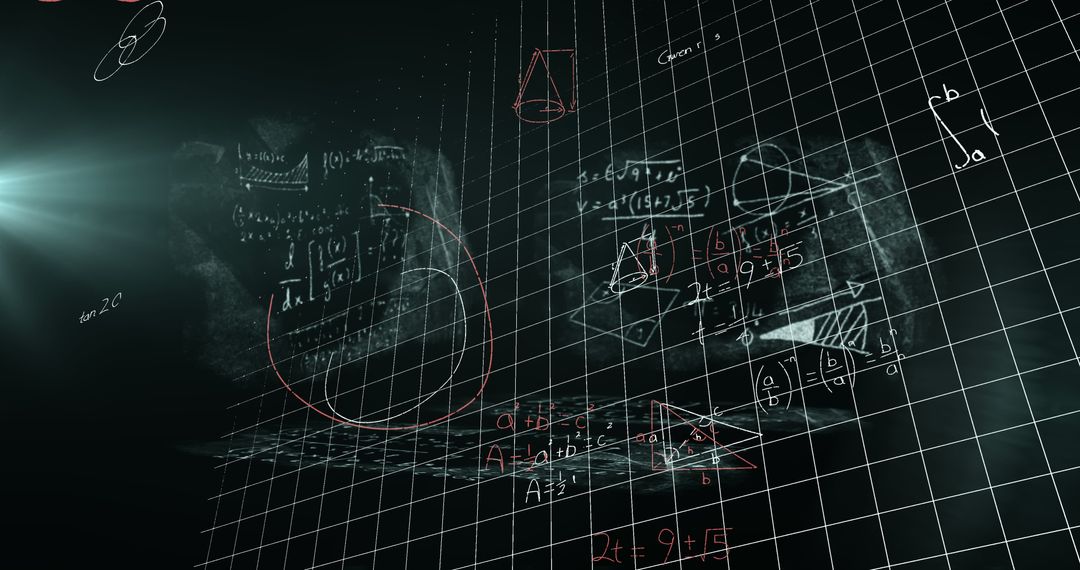
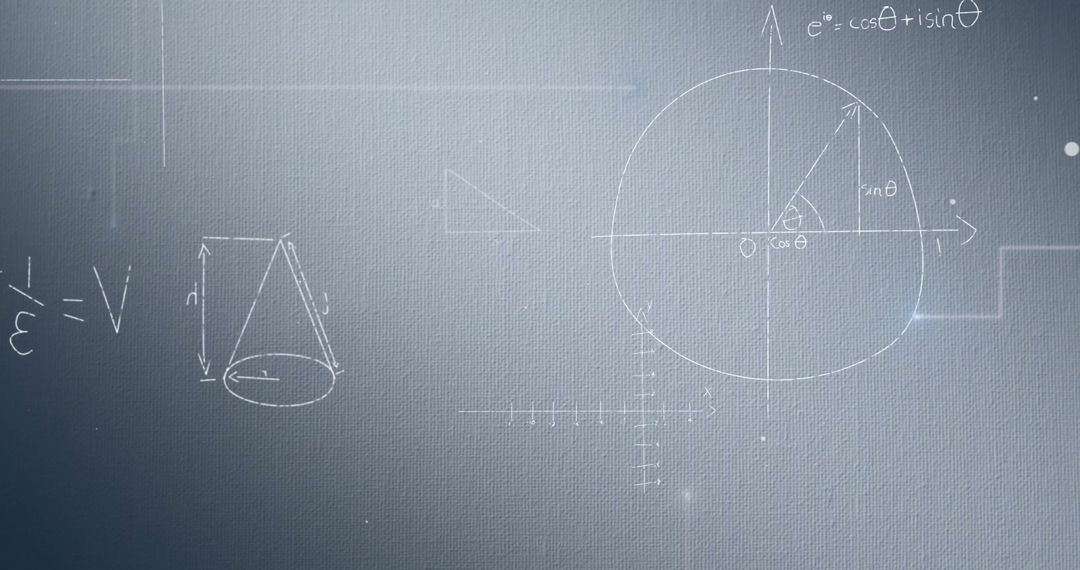
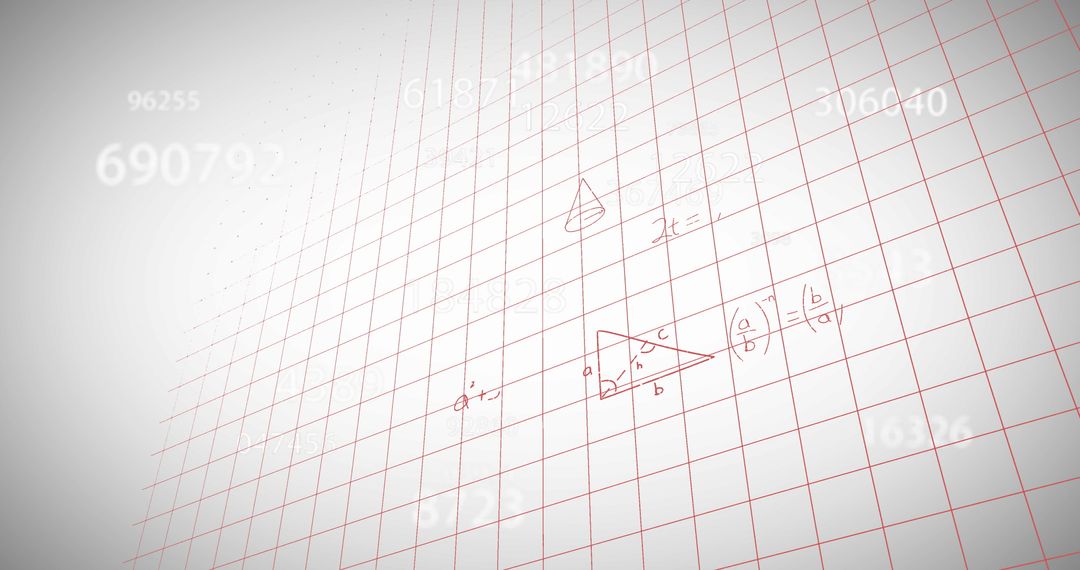
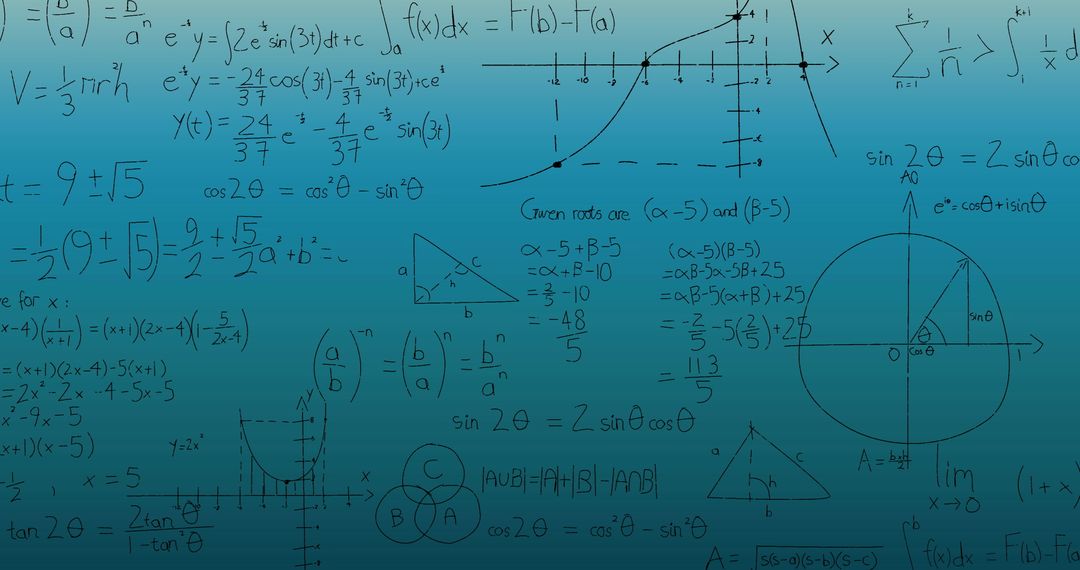
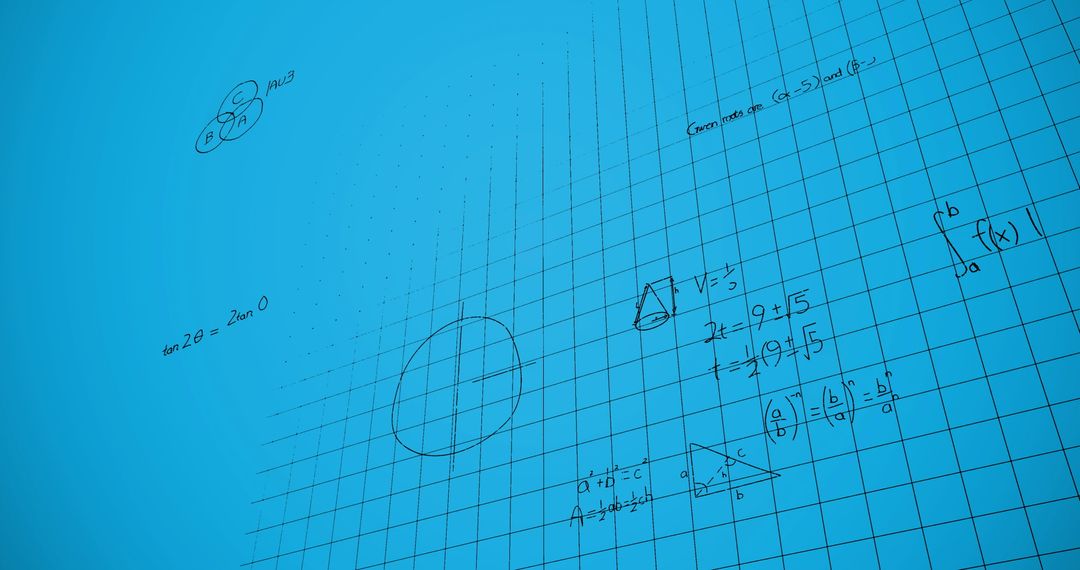
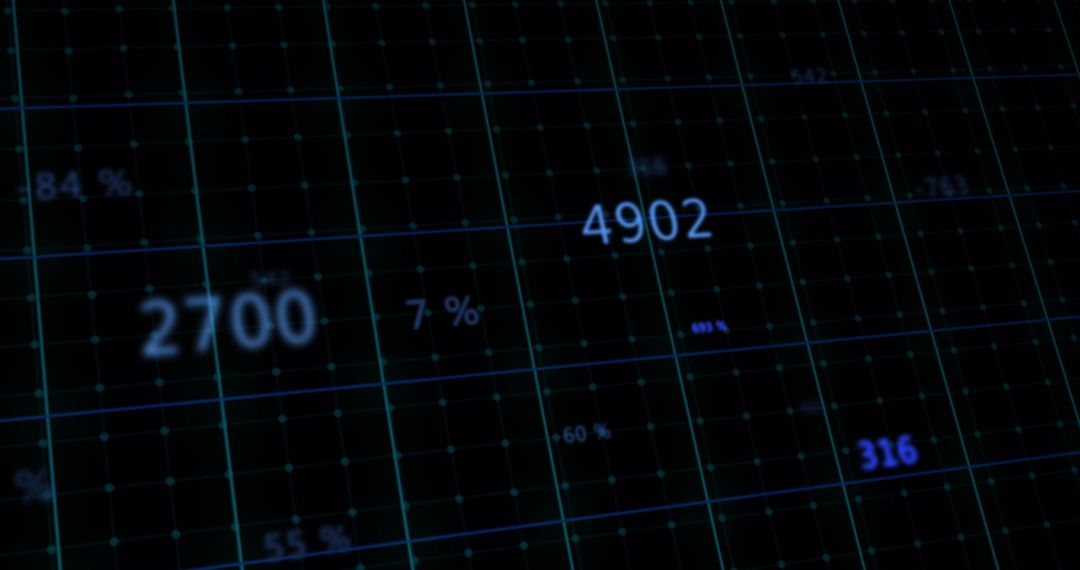
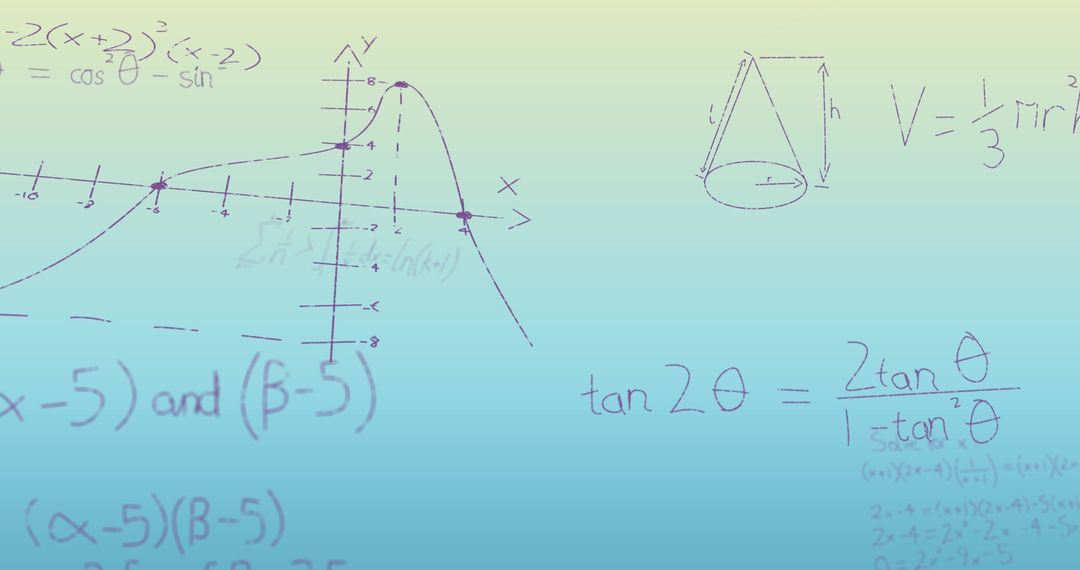
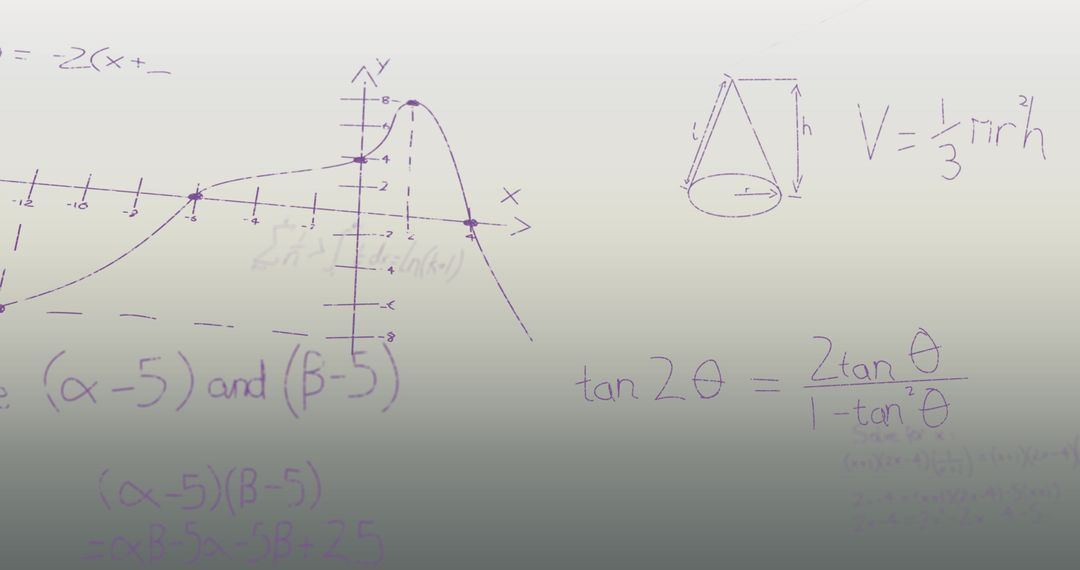
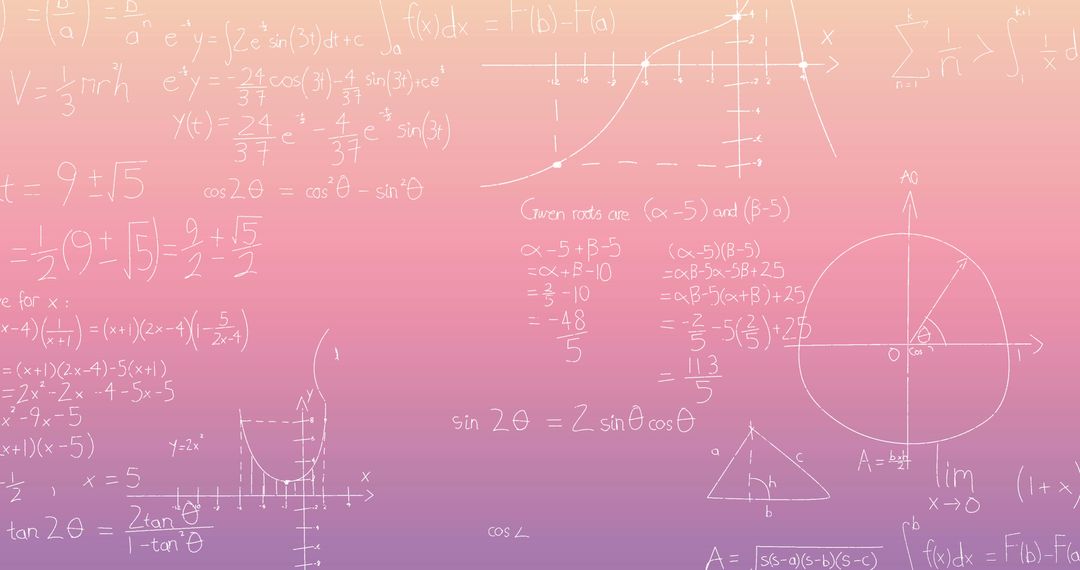
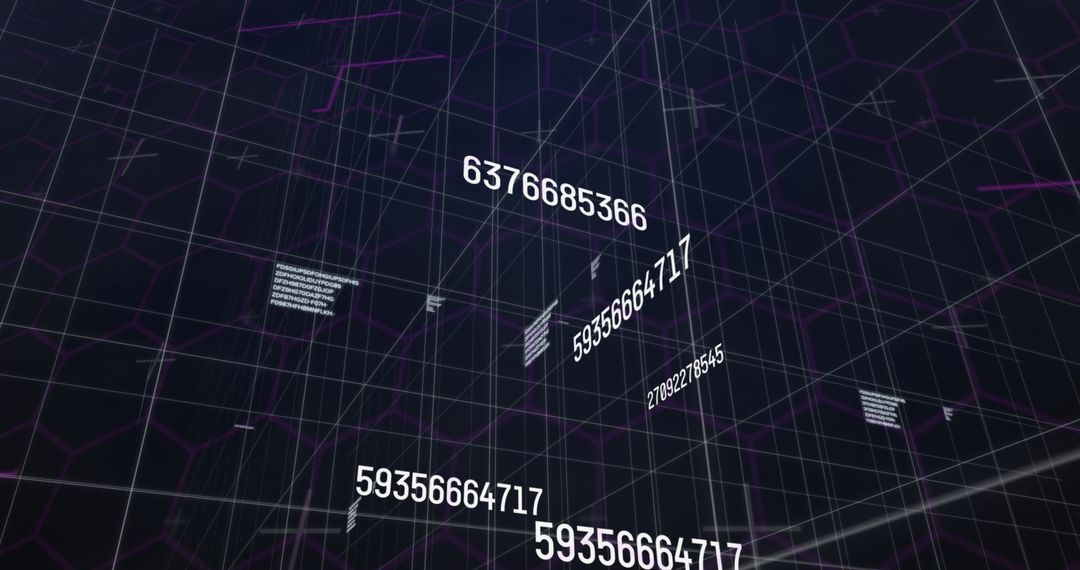
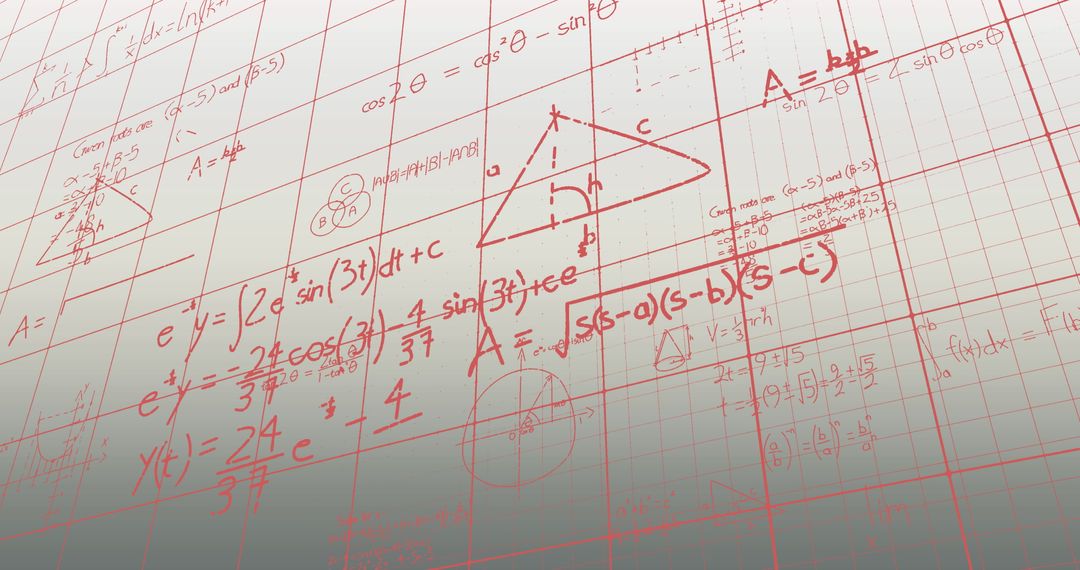
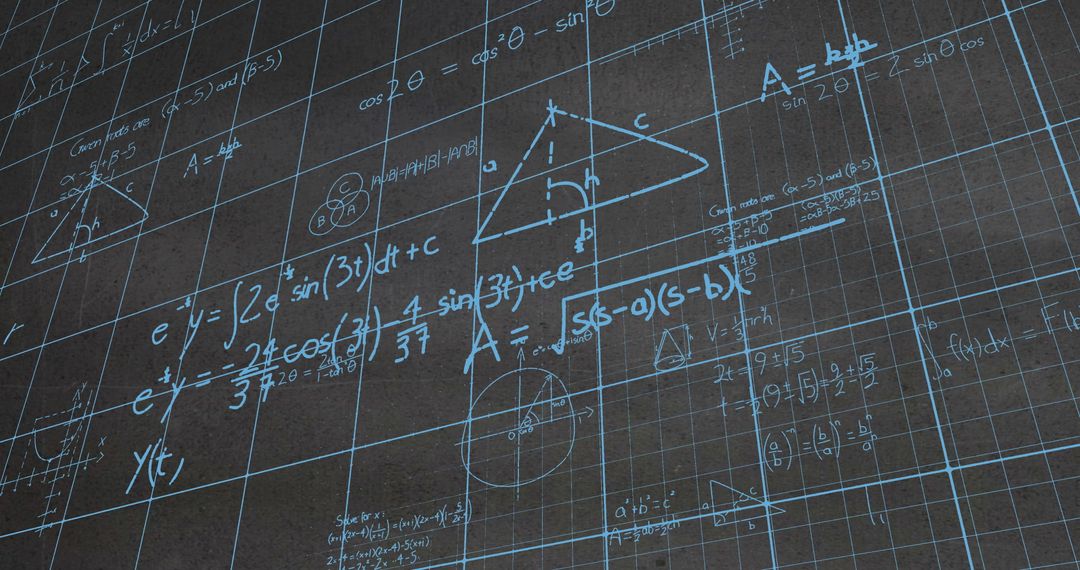
- Mathematical Equations on Black Grid Background with Red Lines
Mathematical Equations on Black Grid Background with Red Lines Image
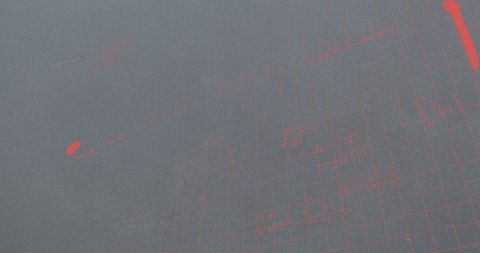
This abstract design features mathematical equations on a dark grid with red highlights, symbolizing data processing and technological advancement. Ideal for educational materials, scientific publications, and presentations about mathematics, technology, and data visualization.
Powered by 


2
downloads
downloads
Tags:
More
Credit Photo
If you would like to credit the Photo, here are some ways you can do so
Text Link
photo Link
<span class="text-link">
<span>
<a target="_blank" href=https://pikwizard.com/photo/mathematical-equations-on-black-grid-background-with-red-lines/9c3bc1819dc013ff0171128d07bc6b16/>PikWizard</a>
</span>
</span>
<span class="image-link">
<span
style="margin: 0 0 20px 0; display: inline-block; vertical-align: middle; width: 100%;"
>
<a
target="_blank"
href="https://pikwizard.com/photo/mathematical-equations-on-black-grid-background-with-red-lines/9c3bc1819dc013ff0171128d07bc6b16/"
style="text-decoration: none; font-size: 10px; margin: 0;"
>
<img src="https://pikwizard.com/pw/medium/9c3bc1819dc013ff0171128d07bc6b16.jpg" style="margin: 0; width: 100%;" alt="" />
<p style="font-size: 12px; margin: 0;">PikWizard</p>
</a>
</span>
</span>
Free (free of charge)
Free for personal and commercial use.
Author: Creative Art
Similar Free Stock Images

Premium


Premium


Premium


Premium


Premium


Premium


Premium


Premium


Premium


Premium


Premium

Premium


Premium

Premium


Premium


Premium


Premium


Premium


Premium


Premium


Premium


Premium


Premium


Premium