- Home >
- Stock Photos >
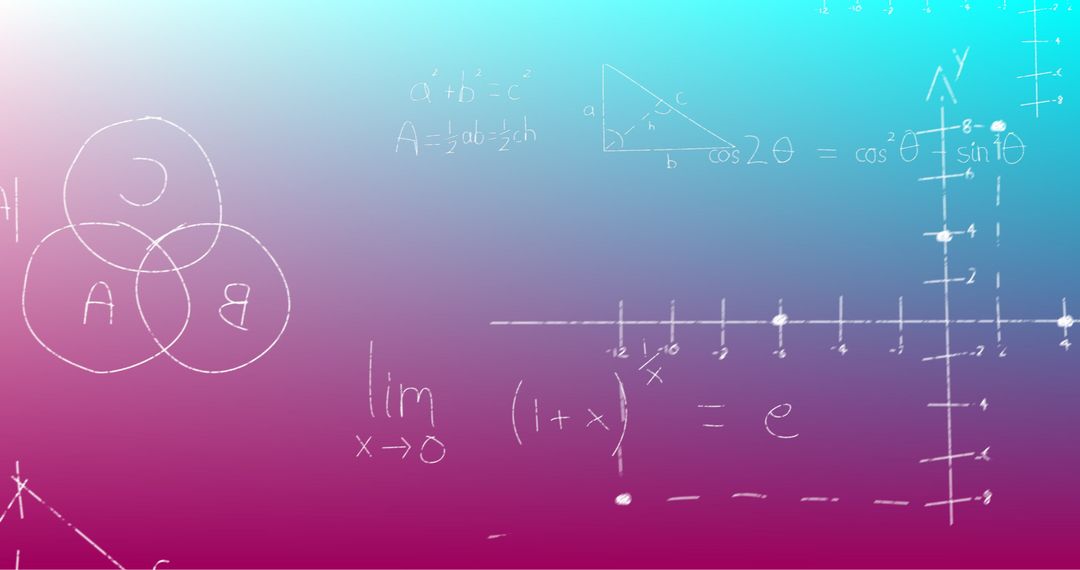
- Mathematical Formulas over Colorful Light Trails Background
Mathematical Formulas over Colorful Light Trails Background Image
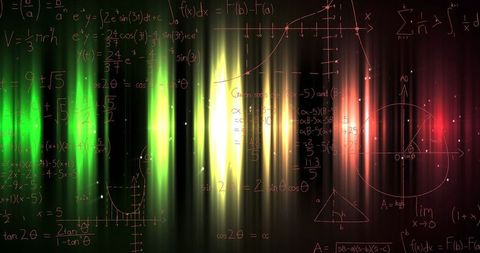
This visually engaging composition displays mathematical equations and diagrams superimposed on vivid light trails. The contrast between sharp mathematical lines and the colorful backdrop creates a striking blend of art and science. Ideal for education, technology promotion, scientific conferences, and themed artwork for classrooms or study materials.
Powered by  - Get 15% off with code: PIKWIZARD15


0
downloads
downloads
Tags:
More
Credit Photo
If you would like to credit the Photo, here are some ways you can do so
Text Link
photo Link
<span class="text-link">
<span>
<a target="_blank" href=https://pikwizard.com/photo/mathematical-formulas-over-colorful-light-trails-background/db23a9d562260b90a79eabdc7625ae6f/>PikWizard</a>
</span>
</span>
<span class="image-link">
<span
style="margin: 0 0 20px 0; display: inline-block; vertical-align: middle; width: 100%;"
>
<a
target="_blank"
href="https://pikwizard.com/photo/mathematical-formulas-over-colorful-light-trails-background/db23a9d562260b90a79eabdc7625ae6f/"
style="text-decoration: none; font-size: 10px; margin: 0;"
>
<img src="https://pikwizard.com/pw/medium/db23a9d562260b90a79eabdc7625ae6f.jpg" style="margin: 0; width: 100%;" alt="" />
<p style="font-size: 12px; margin: 0;">PikWizard</p>
</a>
</span>
</span>
Free (free of charge)
Free for personal and commercial use.
Author: Awesome Content
Similar Free Stock Images

Premium


Premium


Premium


Premium


Premium


Premium


Premium


Premium


Premium


Premium


Premium


Premium


Premium


Premium


Premium


Premium


Premium


Premium


Premium


Premium


Premium


Premium


Premium


Premium


Premium