- Home >
- Stock Photos >
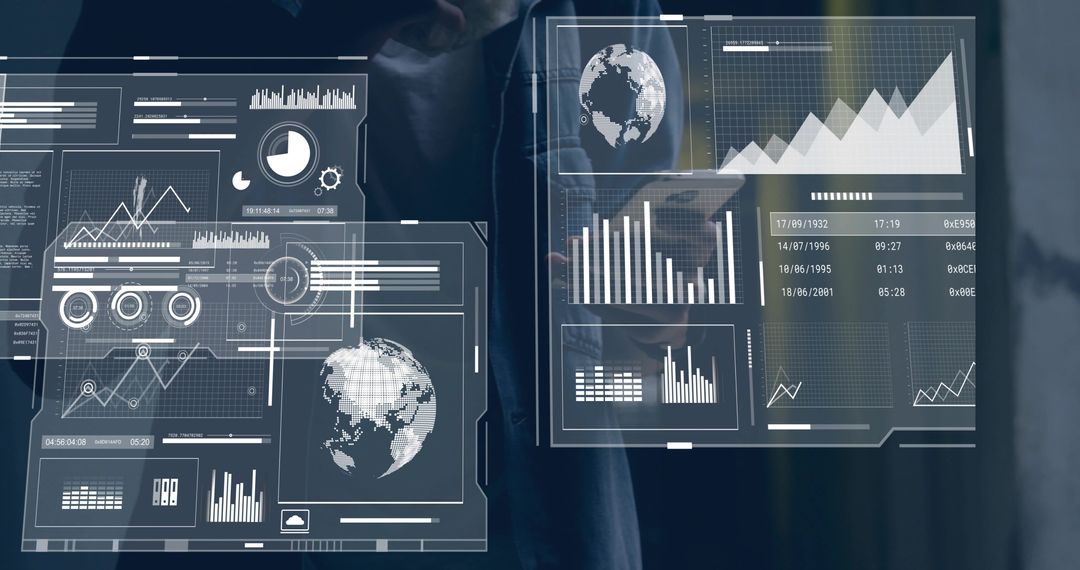
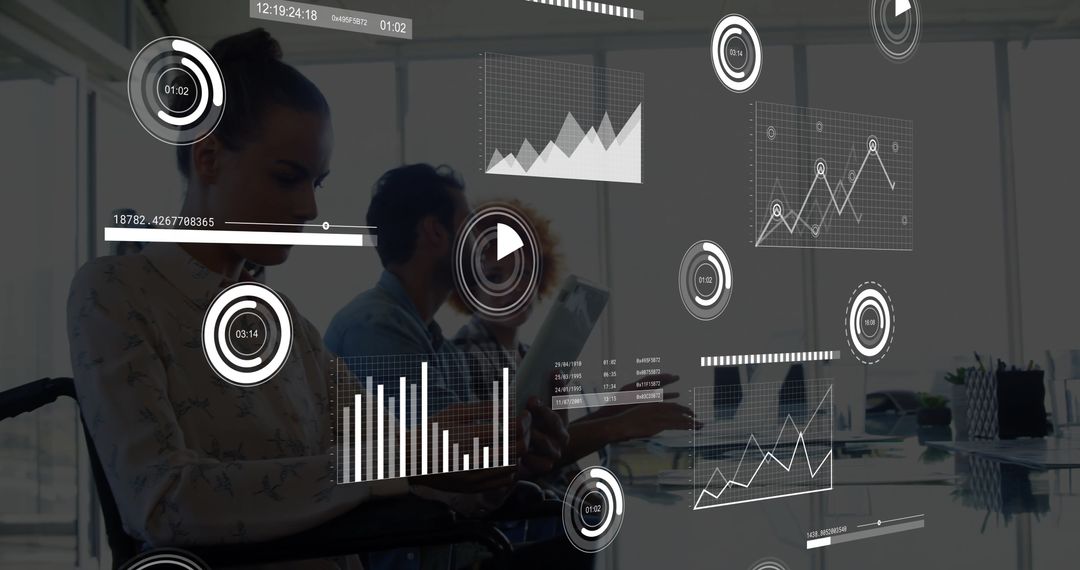
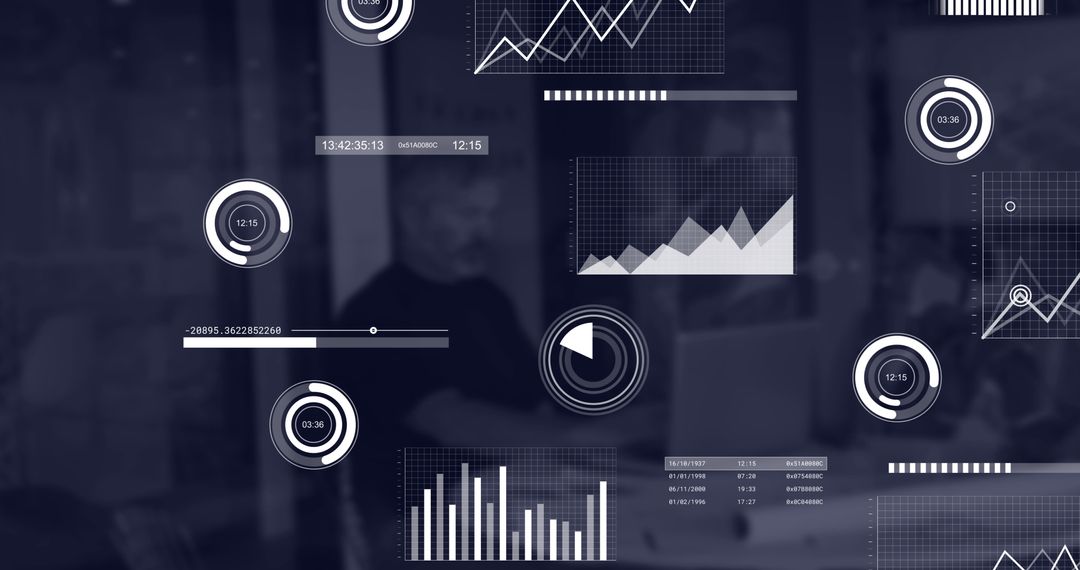
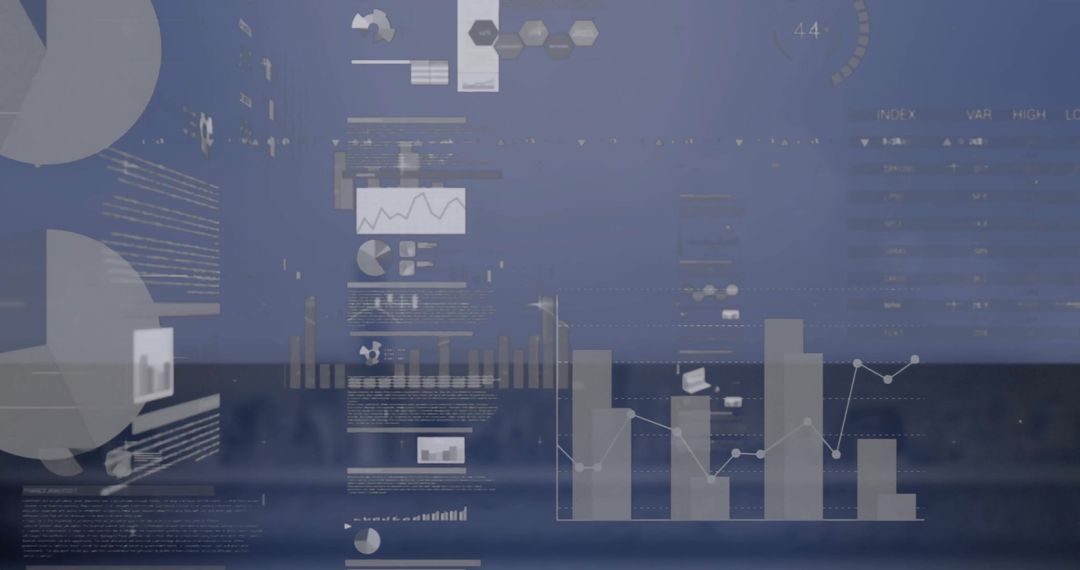
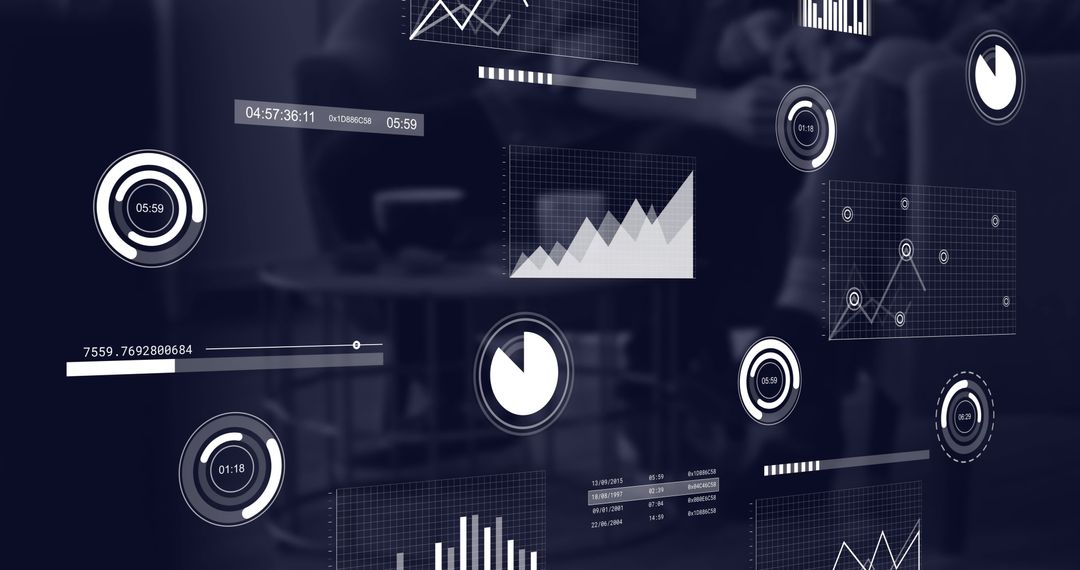
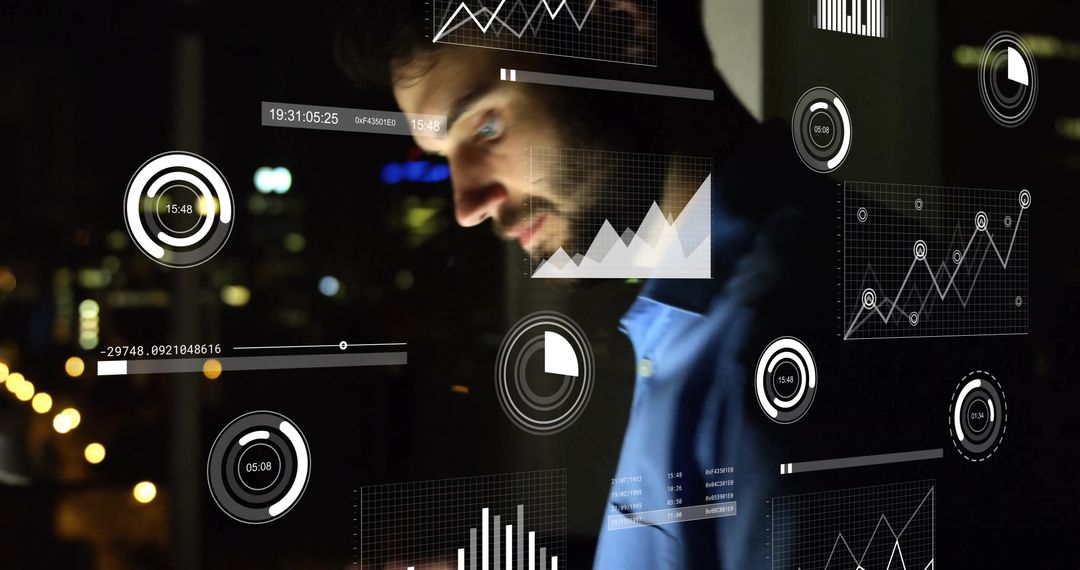
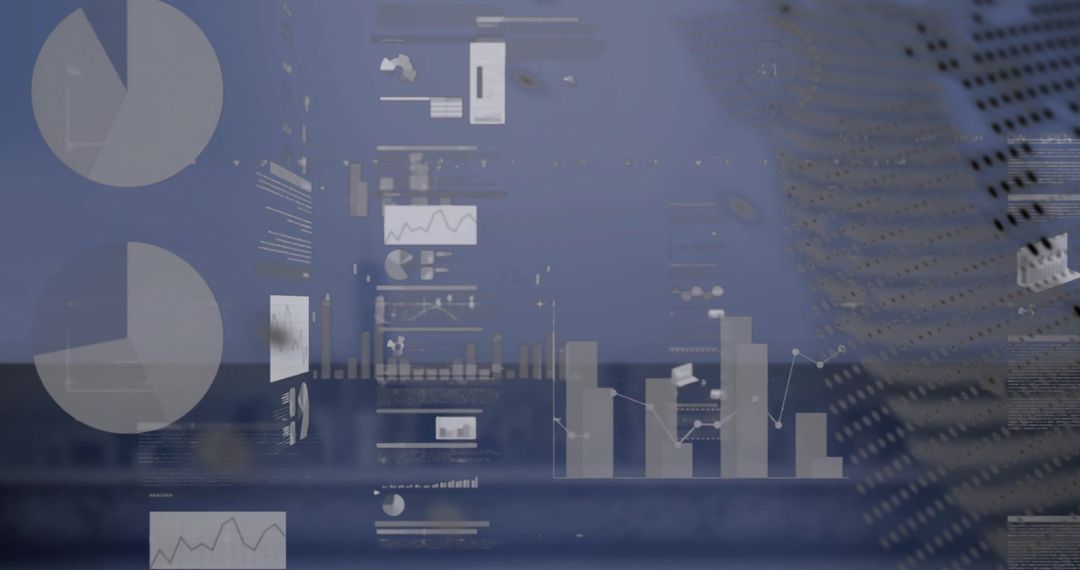
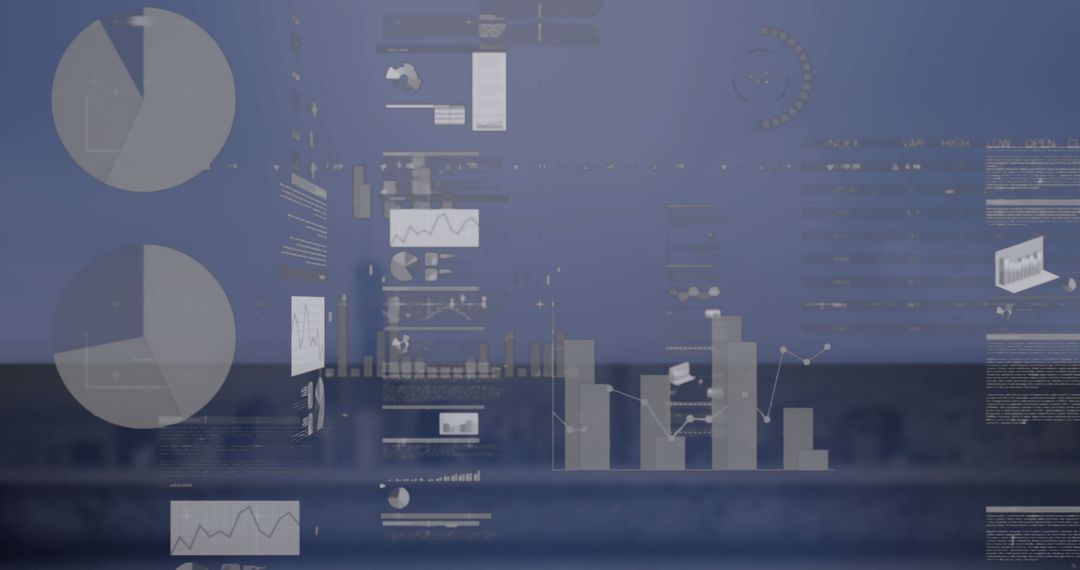
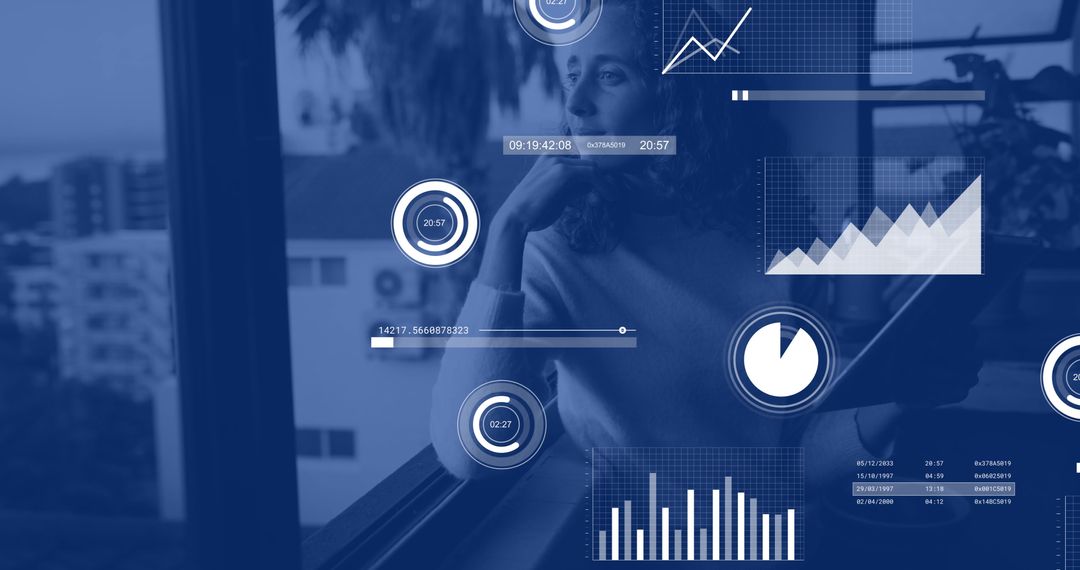
- Mid-Adult Man Peeking Over Monitor Observing Futuristic Data Dashboard HUD
Mid-Adult Man Peeking Over Monitor Observing Futuristic Data Dashboard HUD Image

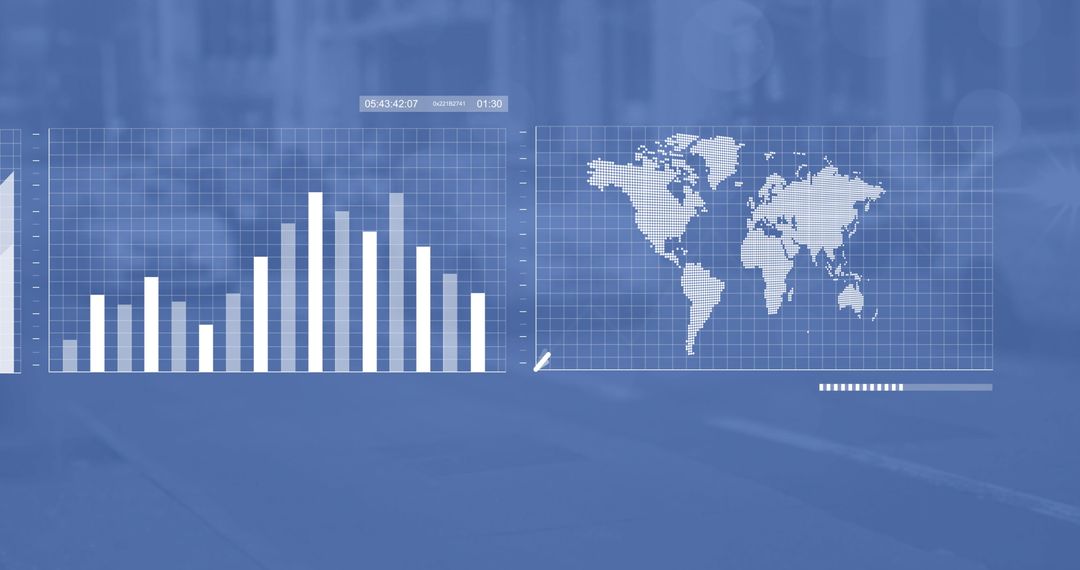
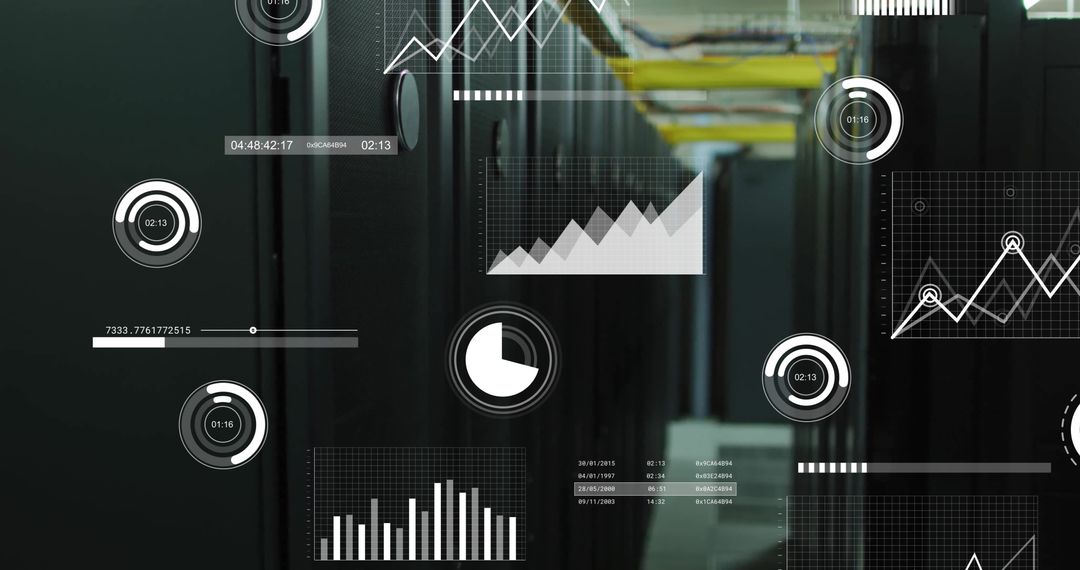
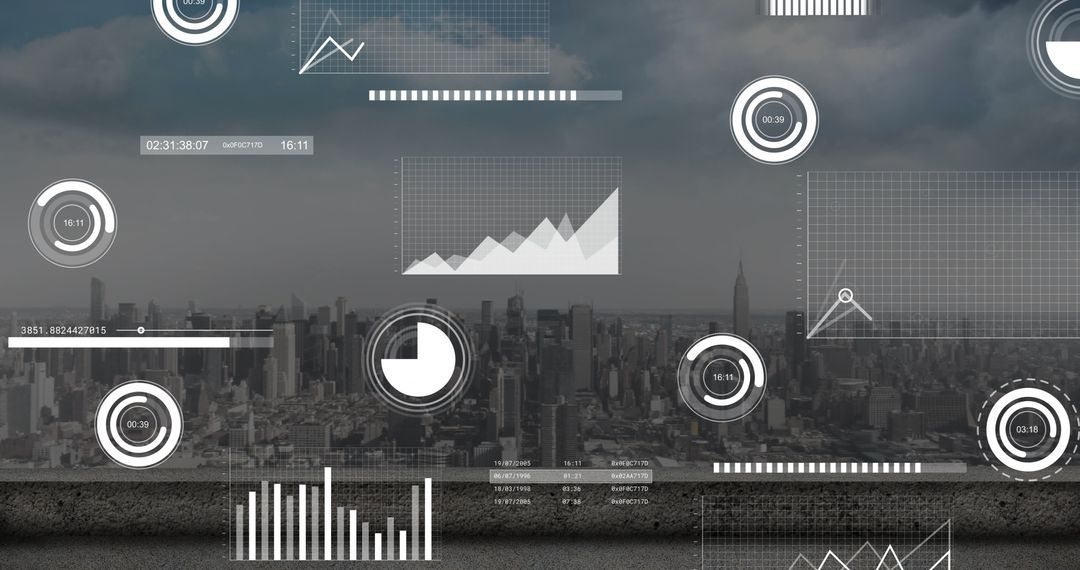
Peeking mid-adult man over monitor while holographic dashboards and HUD charts float across office background, blue color grading creating futuristic tech mood. Composition combining human curiosity with abstract data visualization, showing pie charts, line graphs, bar charts, circular timers and numeric readouts. Suitable for fintech, analytics, data science, AI, cybersecurity and SaaS marketing. Use for hero banners, website headers, blog illustrations, pitch decks, investor presentations, annual reports, social media campaigns and corporate training. Workflow suggestions: crop for wide banner layouts, add headline and CTA in empty top area, recolor HUD graphics to match brand palette, animate charts for video intros, overlay transparent text blocks for legibility.
Powered by  - Get 15% off with code: PIKWIZARD15


0
downloads
downloads
Tags:
More
Credit Photo
If you would like to credit the Photo, here are some ways you can do so
Text Link
photo Link
<span class="text-link">
<span>
<a target="_blank" href=https://pikwizard.com/photo/mid-adult-man-peeking-over-monitor-observing-futuristic-data-dashboard-hud/a7e5dcc0a8883d979ac56d13ed32a03b/>PikWizard</a>
</span>
</span>
<span class="image-link">
<span
style="margin: 0 0 20px 0; display: inline-block; vertical-align: middle; width: 100%;"
>
<a
target="_blank"
href="https://pikwizard.com/photo/mid-adult-man-peeking-over-monitor-observing-futuristic-data-dashboard-hud/a7e5dcc0a8883d979ac56d13ed32a03b/"
style="text-decoration: none; font-size: 10px; margin: 0;"
>
<img src="https://pikwizard.com/pw/medium/a7e5dcc0a8883d979ac56d13ed32a03b.jpg" style="margin: 0; width: 100%;" alt="" />
<p style="font-size: 12px; margin: 0;">PikWizard</p>
</a>
</span>
</span>
Free (free of charge)
Free for personal and commercial use.
Author: Awesome Content
Similar Free Stock Images

Premium


Premium

Premium


Premium


Premium


Premium


Premium


Premium


Premium


Premium

Premium


Premium


Premium


Premium


Premium

Premium


Premium


Premium


Premium

Premium


Premium


Premium


Premium


Premium